Visualization is to software developers what vision is to the brain. Just as our brains use vision to process and understand the world around us, product managers/technical leaders in startups use visualization to see and understand the applications and data they are working with.

Illustration depicting common components of data visualizations
The role of test suite visualizations in a CI/CD process is becoming increasingly important as the popularity of automation testing grows. There are many benefits to automating your tests, including the ability to run tests faster and more frequently. However, one of the challenges of automation testing is debugging automation test failures for complex websites and mobile apps.
According to this report, 30–40% of mature companies use tools for implementing unit and integration tests with visualization testing, dedicated functionality and resources to help manage the test plans. On the other hand, among less mature companies, only 12–15% use such tools.
The science behind importance of visualizations
Humans can process images in as little as 13 milliseconds, while it can take up to 150 milliseconds to process text. This difference is due to the fact that our brains are wired to process visual information much faster than written information.
This difference in processing speed is significant, and it underlines the importance and benefits of data visualization in information processing. When we are presented with large amounts of data, it can be very difficult to process all of the information if it is presented in textual form. However, if that same data is presented in a visual format with proper format and labelling, our brains can quickly and easily make sense of it.

With increased data generation, visualizations are likely to gain even more importance
Visualizations allow us to take in large amounts of information quickly and easily, which is why it is such an important tool for information processing. It is applicable to all fields where data is generated and has to be analyzed. In the context of a tech startup, visualizations are a critical part of daily work and decision-making.
As a startup grows, the number of automation test scripts they use to manage the quality of their product will increase. This can make it difficult to keep track of all the tests and their results. However, if the test suites and reports are visualized, it will be much easier to see which tests are passing and which are failing. This will help the startup to quickly identify and fix any issues with their product.
Data visualization with visualization testing are powerful tools, that can help startups to manage and debug their automation test scripts. By visualizing the test plan and reports, startups can quickly identify issues and take corrective action.
How to solve common test automation debugging challenges
Automation test plans and results can be visualized using graphs, charts and tables on dashboards and documents. Using dashboards for this purpose is especially popular as they are dynamic applications suitable for collaboration across teams and roles. Some common issues faced by tech startups while debugging complex automation test failures are:
- Lack of clear error messages: When an automation test fails, it is often difficult to understand why the failure occurred if the code has improper error handling, or there is no error message. This can make it difficult to debug the failure and identify the root cause. By visualizing the automation test results on a live dashboard, teams can monitor the execution of tests and see a list of all running and scheduled tests. Identifying the failing test by name can help locate relevant modules for fixing. System logs play major role in debugging such scenarios.

A snapshot of popular CI tool Jenkins with TestComplete plugin for unit testing
- Inconsistent test results: Another common issue with automation tests is that they often produce inconsistent results. This can be due to a number of factors, such as changes in the environment or code, or bugs in the test itself. This inconsistency can make it difficult to trust the results of the tests and make decisions based on them. Saving and then comparing test reports across time can help with identifying changing outcomes making it easier to see which tests are producing inconsistent results. Also, use an automation tool that can generate consistent test environments. This will ensure that the environment in which the tests are run is always the same, which will eliminate any inconsistencies in the results.
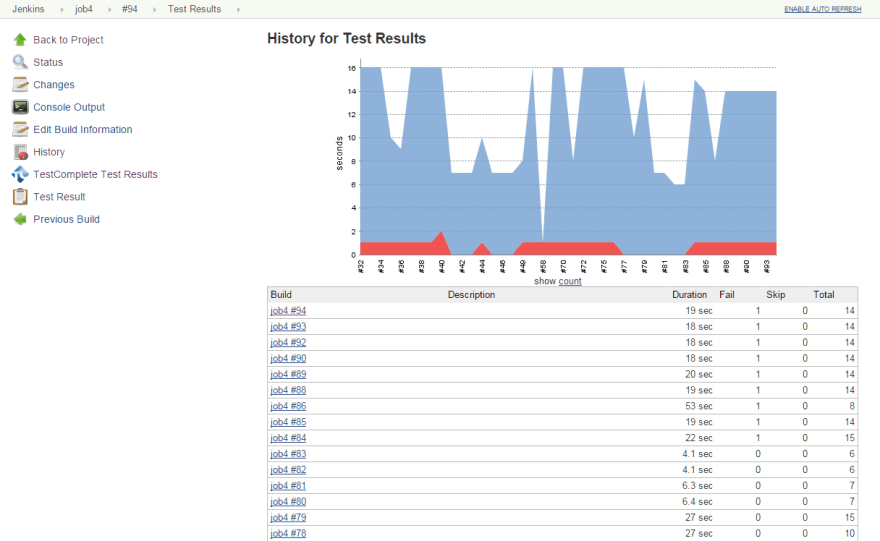
Test results with history on Jenkins Dashboard
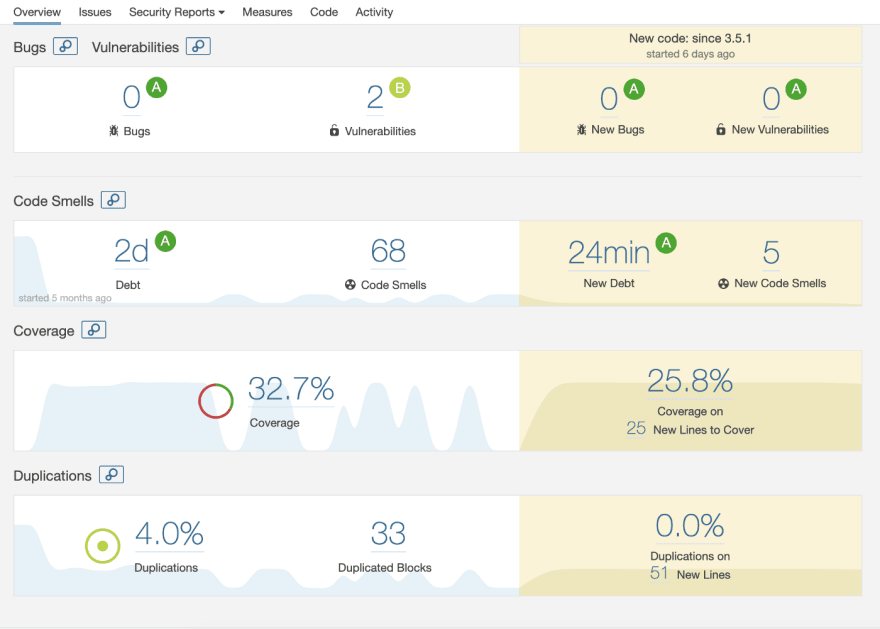
- Lack of test coverage: If a test plan does not have adequate test coverage, it may lead to missed critical bugs that could impact the product. By recording and visualizing the test coverage, we can quickly identify the areas that are not covered by tests. Tools like SonarQube, Jacoco etc. can be used to visualize the test coverage.
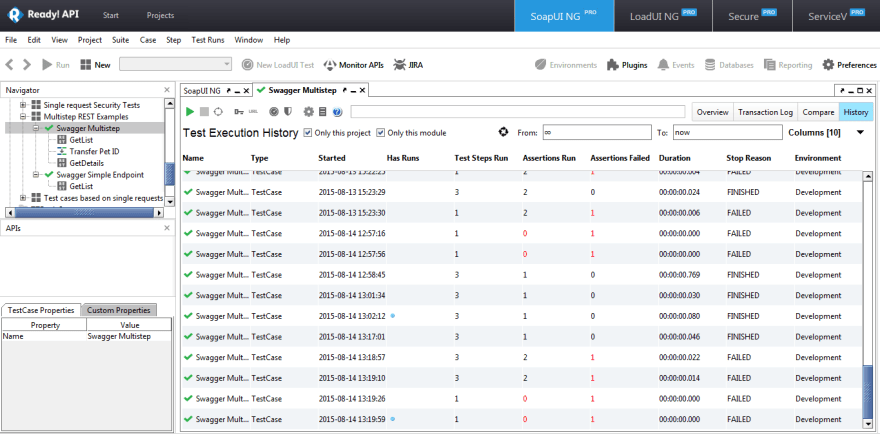
- Tests taking too long to run: Automation tests that take a long time to run can be very frustrating for those who have to wait for them to finish. Delays could be due to technical issues with the implementation, or the test suite could be very large with many dependencies resulting in slow execution. This can impact productivity and lead to frustration and even resentment towards the testing process. By scheduling test runs and report we can eliminate the need to manually trigger tests. Also, monitoring the time taken for each run can help track which part of the test takes more time than it should. SoapUI ReadyAPI is a popular tool used for integration testing on APIs
- Tests not covering all scenarios: Automation tests should cover all possible scenarios that could occur during the use of the software being tested. However, this is often not the case, and some important scenarios may be missed by the tests. This can lead to critical errors being missed by the tests and cause serious problems for users of the software. This is a tricky situation because if the scenario is not a part of the test plan, there is no way for the visualization to pick up the missing part. Hence, it is recommended to make sure all approved business requirements are properly documented and communicated to the developer and automation tester properly. Also, you can add a layer of white-box tests like an automated visual regression test as the final validation step before releasing a build version.
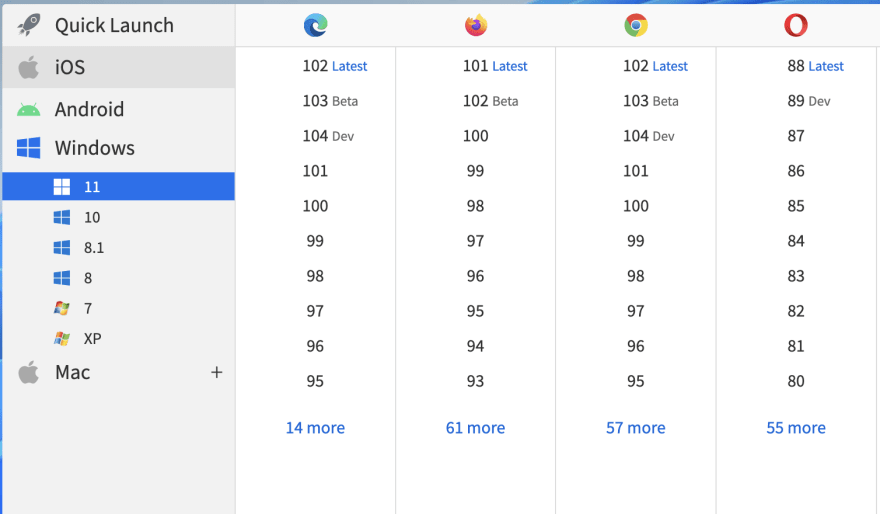
- Inconsistent test environments: If the environment in which the automation tests are run is not consistent, or the environment is not an accurate representation of the real-world use case, it can lead to false positives or false negatives. This can make it difficult to trust the results of the tests and makes debugging more difficult. By using a tool which provides a high-quality and reliable execution environment you can minimize the issues. BrowserStack's Real device cloud provides access to 3000+ devices, OS and browsers.
- Unstable dependencies: Automation tests often rely on other software components, such as libraries or frameworks. If these dependencies are unstable, this can lead to test failures. It can also occur due to improper versioning in code or using deprecated or unsupported functionality in the app. Maintaining the versioning of dependencies as part of project specification and documentation can help. Also, by capturing and visualizing the logs at various checkpoints in the CI/CD process, you can ensure that all dependencies are installed correctly and the build is completed with all necessary version requirements resolved.
- Race conditions: Race conditions can occur when two or more threads of execution access shared data and one thread modifies the data before another thread has a chance to read it. This can lead to unpredictable results and makes debugging very difficult. A dashboard with live updates and configurable warnings on resource consumption can help monitor and avoid deadlocks. Ideally, the scripting of test runs should be done keeping in mind the available computing capacity and memory.


Top comments (0)