In this post, you will learn how to use the IBM Log Analysis with LogDNA service to configure cluster-level logging for an app named Knative-node-app published in IBM Cloud Kubernetes Service. Refer this post - Install Knative with Istio and deploy an app on IBM Cloud, to setup a nodejs app.
IBM Log Analysis with LogDNA offers administrators, DevOps teams, and developers advanced features to filter, search, and tail log data, define alerts, and design custom views to monitor application and system logs.
From the moment you provision a cluster with IBM Cloud Kubernetes Service, you wish to know what is happening inside the cluster. You need to access logs to troubleshoot problems and pre-empt issues. At any time, you want to have access to different types of logs such as worker logs, pod logs, app logs, or network logs. In addition, you can monitor different sources of log data in your Kubernetes cluster. Therefore, your ability to manage and access log records from any of these sources is critical. Your success managing and monitoring logs depends on how you configure the logging capabilities for your Kubernetes platform.
Provision an IBM Log Analysis with LogDNA instance and Configure the LogDNA agent
Before provisioning the instance, Check the Prerequisites
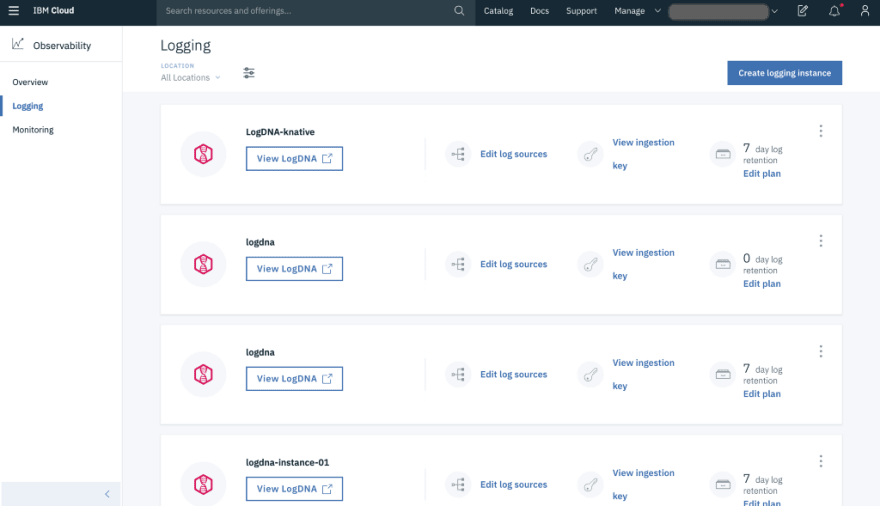
Once you have the app running on the Knative Kubernetes Cluster, provision an instance of the IBM Log Analysis with LogDNA service
- Choose a region/location (us-south)
- Select a resource group
- Select an appropriate plan ( 7 day Log Search recommended for this post)
- Click create. With this step, you configure a centralized log management system where log data is hosted on IBM Cloud.
Configure your Kubernetes cluster to send logs to your LogDNA instance
- Once the service is provisioned under https://cloud.ibm.com/observe/logging, click on Edit log sources and then click Kubernetes.
- You should see two commands to automatically install a logdna-agent pod on each node of your cluster.
kubectl create secret generic logdna-agent-key --from-literal=logdna-agent-key= **<INGESTION_KEY>**

kubectl create -f https://repo.logdna.com/ibm/prod/logdna-agent-ds-us-south.yaml
- This configures the LogDNA agent on every worker (node) in a cluster.

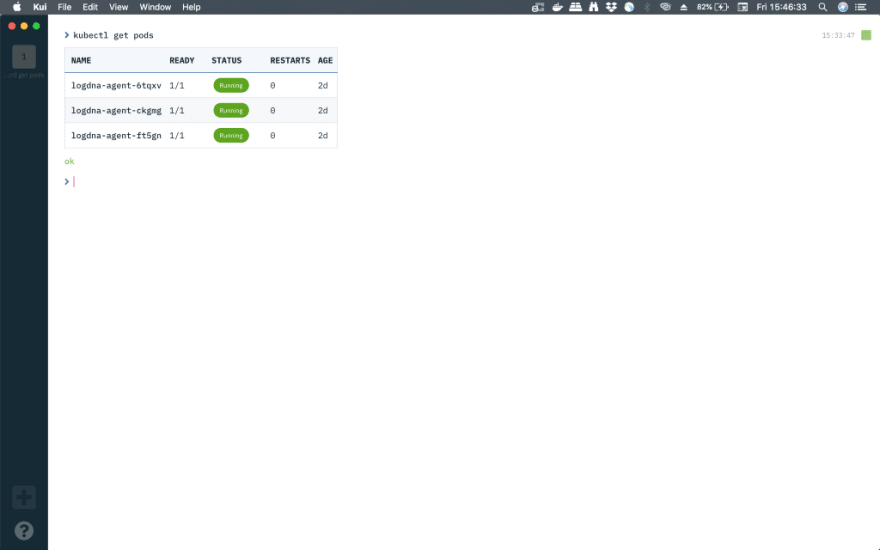
- To confirm the successful creation of LogDNA agent on every worker node in the cluster, run the below command
kubectl get pods
Launch the LogDNA dashboard and view logs
Let’s check and search the logs and also create some graphs by clicking View LogDNA. On a new tab , Under Everything , you should start seeing all the logs in realtime.
For this, we need to generate some traffic/load and there are many open source libraries/tools available. In the post, we will be using Vegeta, an HTTP load testing tool and library. You can also use hey.
Before generating the load, let’s quickly check whether the IP_ADDRESS and HOST_URL are set properly while deploying the app.
echo $IP_ADDRESS

echo $HOST_URL
After installing Vegeta, run the below command
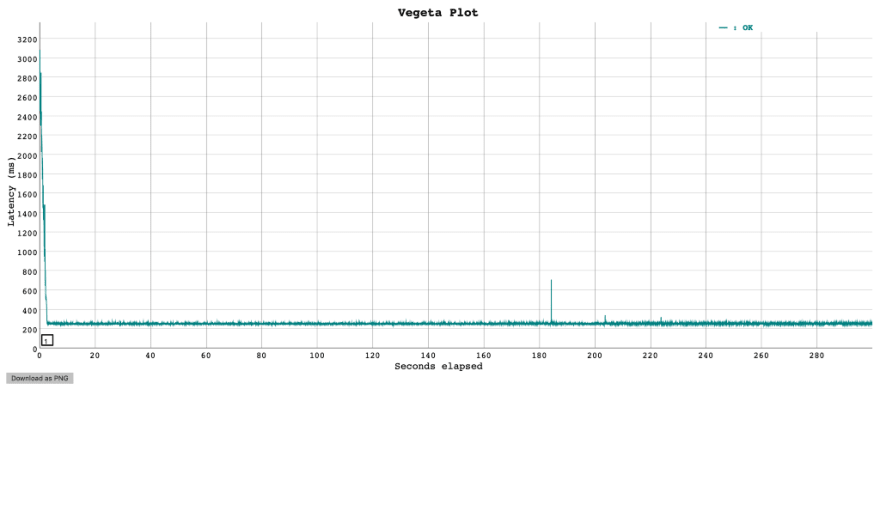
echo “GET [http://${IP_ADDRESS](http://%24%7BIP_ADDRESS)}" | vegeta attack -duration=300s -header “Host: ${HOST_URL}” | tee results.bin | vegeta report
 vegeta report -type=json results.bin > metrics.json
 cat results.bin | vegeta plot > plot.html
 cat results.bin | vegeta report -type=”hist[0,100ms,200ms,300ms]”
You can open the plot.html file in the folder you have run the above command to see the Vegeta plot
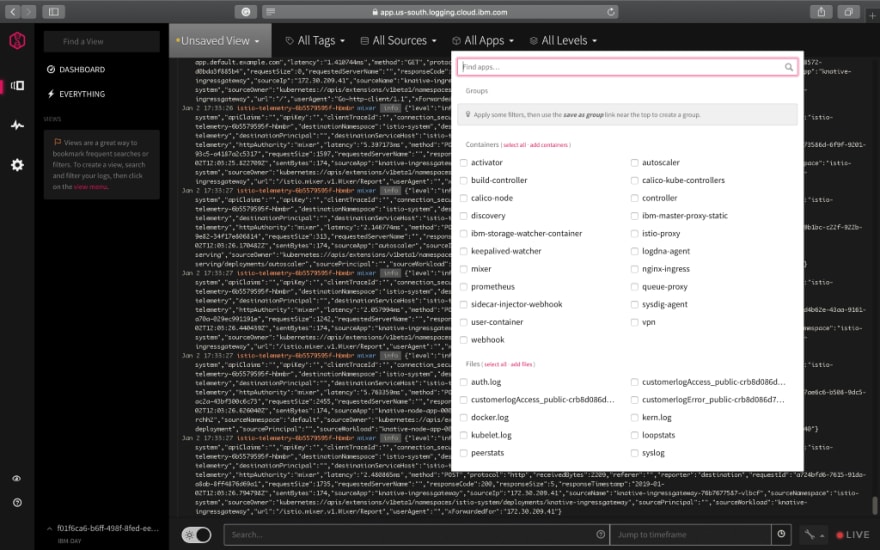
On the LogDNA dashboard, you can search/filter for various fields in the search box and also highlight the terms you are interested in. You can also save this as a View as a bookmark by clicking on Unsaved View .

For archiving logs to IBM Cloud Object Storage , refer this link
You can filter the logs by tags, sources, Apps and Levels (info, error etc.,)
Boards and Graphs
A board is a named collection of graphs and is similar to a view. All boards are located in the Boards List and may contain any number of graphs. Changes made to a board are automatically saved.
To create a new board, on the left pane > click on the icon below the dashboard and click +NEW BOARD. Let’s call this knative-board.
- Click on +Add Graph.
- Select destinationApp as the field to graph.
- Choose knative-node-app-00001 as the optional value and click add graph.

A new graph will be created with a plot of destinationApp over a period of 24 hours (Feel free to change the timeframe). You can also add a new plot by clicking +Add Plot below the graph.
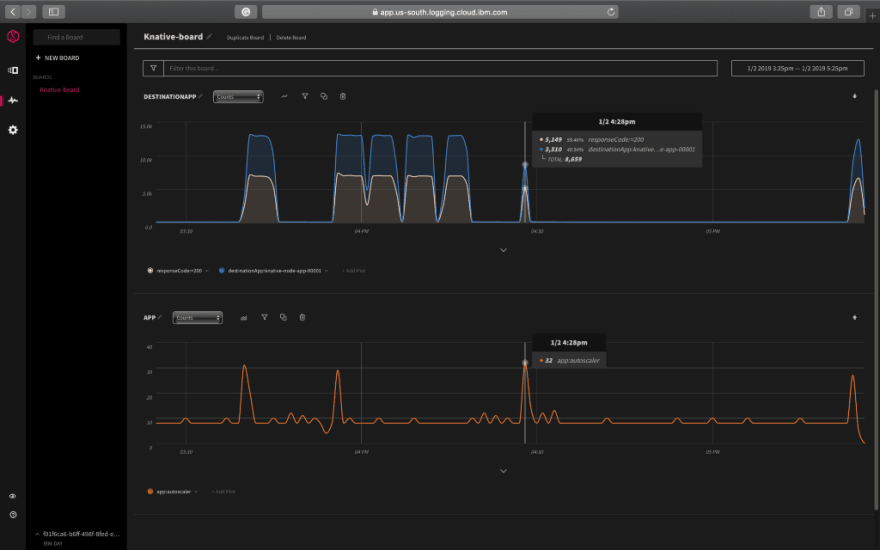
As Knative is known for its autoscaling capabilities, Let’s see how the autoscaler behaves with incoming traffic/requests by adding a new graph as shown in the image above.
Knative Serving Autoscaler — another k8s Deployment running a single Pod which watches request load on the Pods running user code. It increases and decreases the size of the Deployment running the user code in order to compensate for higher or lower traffic load.
Additionally, as an extension to the graphs you created, you can see the breakdown (a histogram) of various fields like nodes, destinationNames etc., by clicking on the arrow below the graph > +Add. You can create multiple breakdowns.

We have just touched the tip of the iceberg and there are many fields/metrics to look out for. Explore the tool with different load and filters.
Questions or concerns? Post a question or Reach out on Twitter @ VidyasagarMSC
Further reading
- Working with alerts
- Exporting logs to a local file
- Using Kaniko — Build a container image inside a K8s cluster and push it to IBM Cloud Container Registry
- IBM, Google Give Birth to Knative Serverless Cloud Project
- Knative Docs


Top comments (0)