Kibana as a data visualization engine
Features and capabilities of Kibana are countless. But Kibana can be best described as a powerful interface for accessing Elasticsearch data and making sense of it.
In most cases, Elasticsearch is used as a primary data store. But Kibana can collect diverse data in one centralized place and provide all sorts of eye-catching visualizations for analyzing this data.
Later on, you can bring all created visualizations together on a single dashboard - the most remarkable feature of Kibana. The main purpose of these dashboards is to get a real-time picture of your data, communicate information efficiently and share it within the team.
Besides, since Elasticsearch lies in the heart of the Elastic Stack, working with data is meant to be fast and delightfully easy. In general, all products of the Elastic Stack are effective in terms of development time spent for configuring.
Popular use cases
Most common use cases of a joint work of Elasticsearch and Kibana are log analytics, reporting KPIs, collecting server metrics, security analytics, various business intelligence tasks and many more.
Kibana is widely used in numerous industries: finance, marketing, education, energy and public services, government, healthcare, manufacturing, commerce, media and entertainment, software and technology, telecommunication, travel and a lot more.
The largest companies in the world use Kibana and benefit from it. And this is not without reason. Hundreds of use cases prove that Kibana and Elasticsearch empower organizations to make data-driven decisions.
Open-source nature of Kibana
Kibana is an open-source product and this fact has both advantages and disadvantages. A huge plus is that the product is continuously evolving and becoming better. The community around it is indeed vibrant and active. Many developers are contributing to the development of Kibana's additional capabilities as a product for analysis and visualization. One of the minuses is that such development makes it difficult for developers to keep up with every new major update and make their products compatible with the latest version of Kibana.
Plugins
Among the plugins I’ve managed to test, there is one that notably differs from the others. I’m going to cover its most noteworthy features which may improve your data-driven strategies.
Reporting tool for Elasticsearch
Flexmonster implements the feature which many people longed to see among the available Kibana widgets, namely data pivoting.
Of course, there are plenty of ways to visualize your data in charts, graphs, and maps but you don’t always need exactly these types of presentation. From time to time you need to slice data and explore it interactively before sending to charts.
The main purpose of this plugin is to enable you to extract insights from the data hidden in Elasticsearch documents by displaying it in a summarized view on a grid.
Besides, due to its design, it looks like a native module.
What makes this plugin appealing for analysts?
Availability of all the main reporting features through the UI. Especially I’d like to note the user experience - when working with this tool, everything seemed intuitive and clear.
Ability to personalize the component in the way that fits your requirements.
Interactivity. Both in the field list and on the grid, you can drag and drop fields to change the slice of the data you want to show in the report. Each time you do it, you can see a totally different picture of your data.
A choice of aggregation functions.
Sorting. The values on the grid and members of the hierarchy can be sorted with a few clicks.
Filtering. One can filter data by members and values.
Pivot Charts. There are two modes of the component - the charts and the grid. You can switch between them via the toolbar. This is comfy because you can present the same data in multiple views in a short time.
And what may developers be interested in?
Easy connecting to the available Elasticsearch indices without need to waste time on a long setup.
Ability to save all results. Reports can be stored as JSON files and uploaded later into a component through UI.
Ability to export reports both via the UI. Most popular formats are available: PDF, Excel, CSV, HTML, Image.
This is only a surface analysis of the component’s features which, from my perspective, look promising at first sight.
How to create reports
With the available features, it’s possible to compose a tabular report of any complexity.
Besides, the report’s configuration can be changed anytime later by slicing and dicing the data interactively.
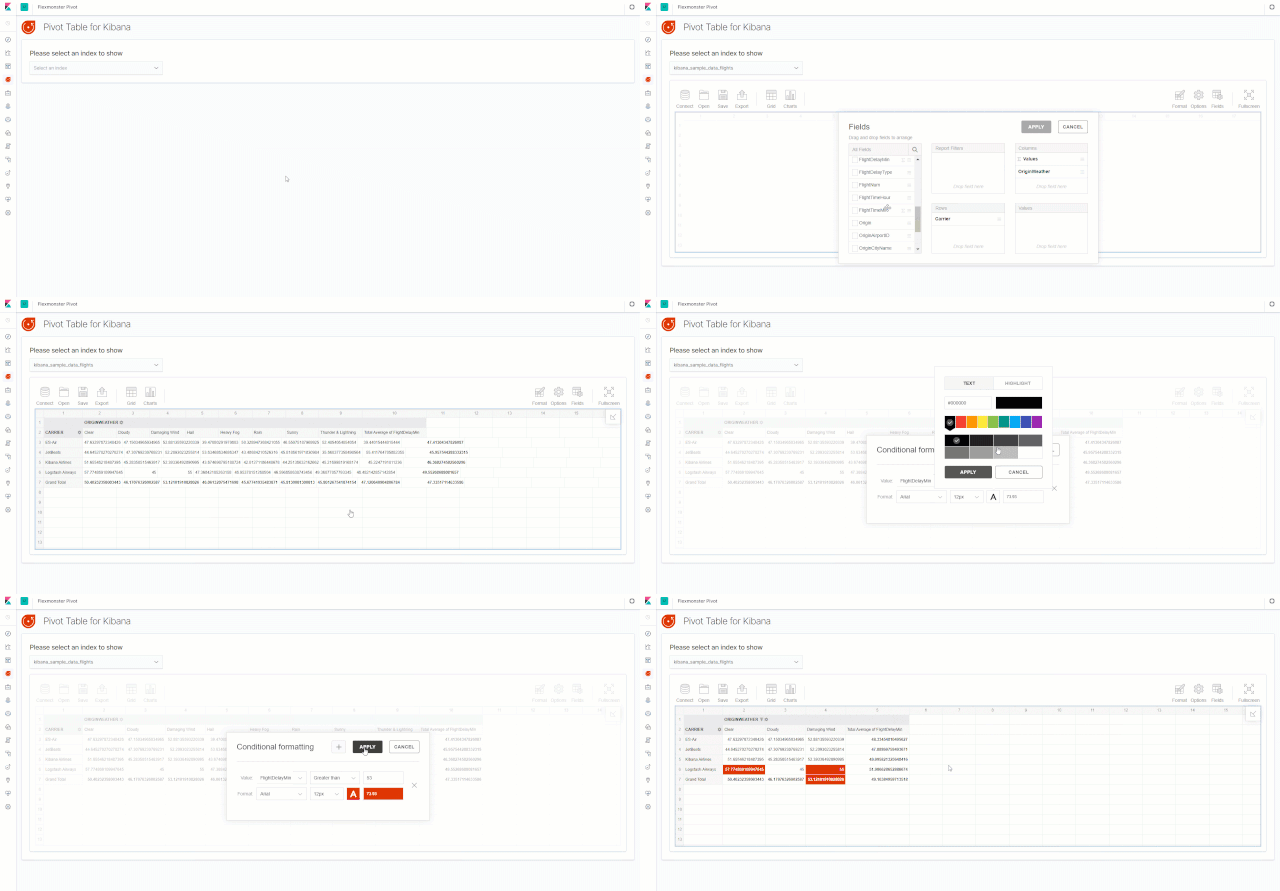
To concentrate on the most important aspects of data, metrics can be highlighted with conditional formatting.
Let me demonstrate how I’ve built a report after installing the plugin to Kibana. Open the gif in a new tab to see the entire process:
That’s it! As a result, I’ve got a carefully crafted report which is ready to be shared across departments.
Personal impression
In my judgment, the process of creating reports is time-saving and allows looking at metrics from different angles. Another thing I’ve noticed is that the component works smoothly and nicely handles large volumes of data. It would be great to add this tool to the dashboard or Canvas alongside with other visualizations.
Final thoughts
Here I’ve shared with you my opinion about Kibana as a powerful data visualization tool and introduced a pivot table plugin which, hopefully, will help you generate intelligible reports based on Elasticsearch documents.
And what are your favorite features of Kibana? Do you use any plugins that help you analyze the data? To your opinion, what features for reporting and visualization would you like to have in Kibana?
I’ll be happy to hear your thoughts.
Thank you for reading!


Top comments (0)