https://colab.research.google.com/drive/1y432ZVmUh1a-AeRbcitH3wj0nLYBjGbT?usp=sharing
Drought is among the most disastrous natural hazards and occurs in virtually all geographical areas. Severe drought events in recent decades have caused huge losses to agriculture, society, and ecosystems with profound impacts on crop production and water supply
Drought prediction plays a key role in drought early warning to mitigate its impacts. In this project I used data science, I analyzed the relevant data of my home state Illinois. The aim was to help investigate if droughts could be predicted using only meteorological data
Data Collected
I chose to work with a dataset from Kaggle that was published by Christoph Minixh. The dataset was gathered by the US drought monitor and the Harmonized World Soil Database from the Food and Agricultural organization of the United Nations. The database compiled by Christopher was to predict 6 levels of continental US drought levels using meteorological & soil data. From the 19 million separate meteorological observations (data rows) I chose to only focus on Illinois.
*Data exploration. *
I first imported the library’s required.

After assigning our four CSV files to file paths and reading them into their respective pandas dataframes, I took a look at the columns. Our target vector, column ‘score’, came equipped with drought severity levels ranging from 0.0 to 5.0, but also quite a few null values

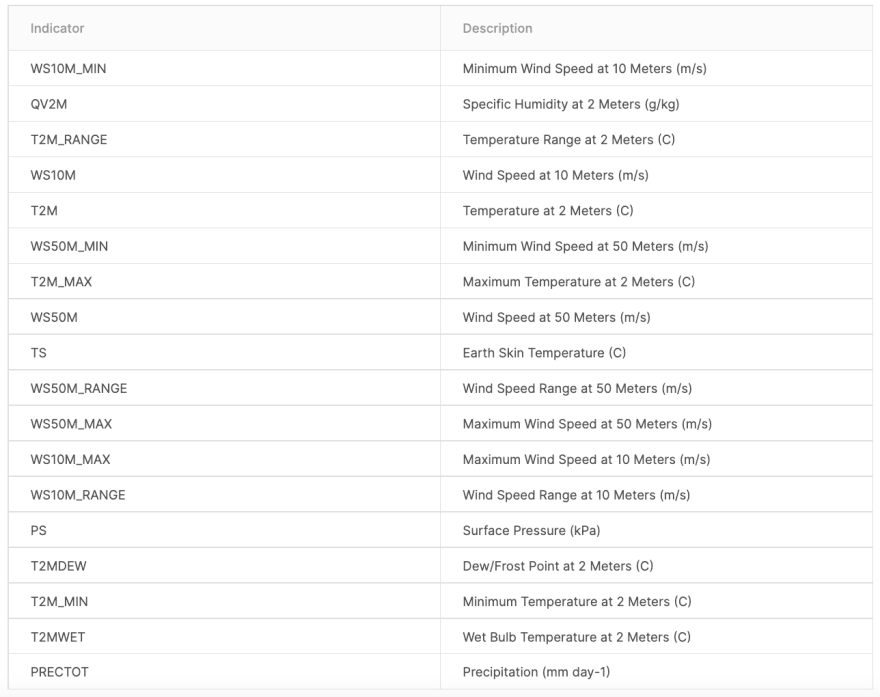
To understand the columns listed in the data. The information of what the indicators mean is below.
After assigning our four CSV files to file paths and reading them into their respective pandas dataframes, I took a look at the columns. Our target vector, column ‘score’, came equipped with drought severity levels ranging from 0.0 to 5.0, but also quite a few null values
When we read the data we can see all the meterogical data
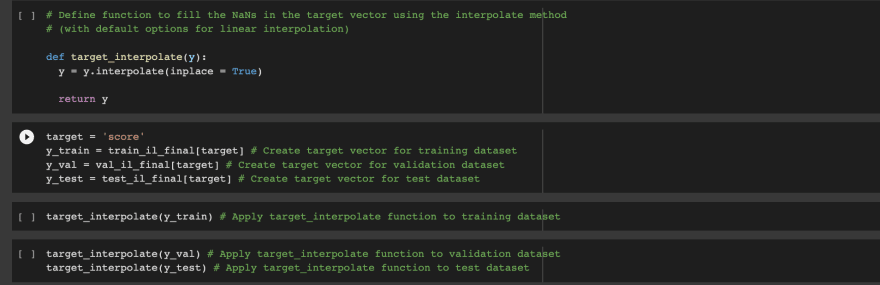
After assigning our four CSV files to file paths and reading them into their respective pandas dataframes, I took a look at the columns. Our target vector, column ‘score’, came equipped with drought severity levels ranging from 0.0 to 5.0, but also quite a few null values.
To impute the logical fill-in values for the empty values, I used the Pandas Series Interpolate function.
 .
.
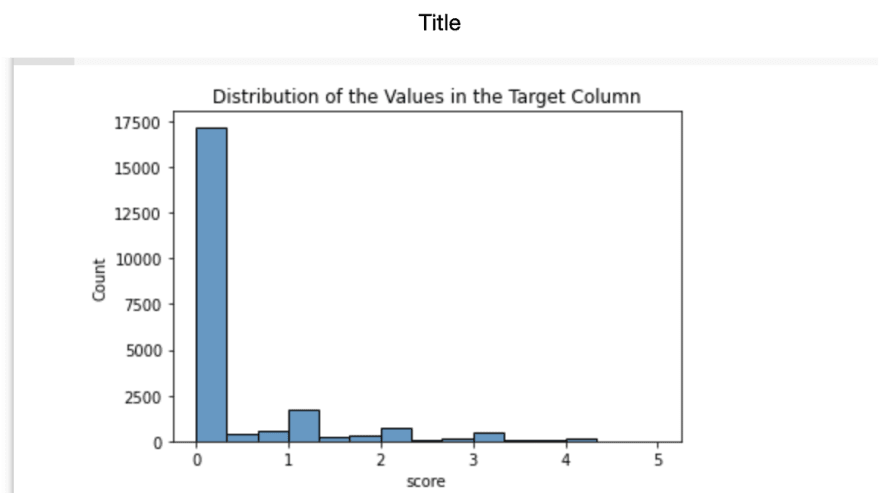
We wish to predict the class of drought severity, denoted by floats of 0.0, 0.1, 0.2, 0.3, 0.4, & 0.5. This gives us six classes, more than two binary classes usually found in classification problems. This means we have a multiclass classification problem.
To analyze the problem as a classification problem, I then wrote a function that transformed the interpolated float values in the target into 6 categories as follows:
‘None’ (score = 0.0) (68% of Training Target)
‘Abnormal (D0)’ (0.0 < score <= 1.0) (25% of Training Target)
‘Moderate (D1)’ (1.0 < score <= 2.0)(5.4% of Training Target)
‘Severe (D2)’ (2.0 < score <= 3.0)(1% of Training Target)
‘Extreme (D3)’ (3.0 < score <= 4.0)(0.4% of Training Target)
‘Exceptional (D4)’ (4.0 < score <= 5.0)(0.0012% of Training Target)
*Establishing a baseline. *
The difference between accuracy_score and balanced_accuracy_score is easily demonstrated by using Scikit-Learn’s dummy classifier (which picks the most_frequent class in the training target). The results for the Validation dataset are as follows:
Baseline Accuracy of the dummy classifier: 0.780
Baseline Balanced Accuracy of the dummy classifier: 0.25
It is clear that accuracy_score is misleading given that a guess of the most_frequent class is accurate close to 80% of the time.
The — balanced_accuracy_score — appears to be a better metric to deal with multiclass classification problems that have imbalanced target than accuracy_score
Models **
To solve this classification problem, I focused on two supervised learning models: **Random Forest and XGBoost. I started with a Random Forest model with 15 trees and used Scikit-Learn’s compute_class_weight to account for the imbalanced target classes.
Then I added a scaler³ to determine whether it improved the models’ performance. The conclusion I reached was that scalers only marginally improved (by 0.0001)
Next, I chose the hyperparameters that optimized the models for the Validation dataset.
I used Scikit-Learn’s SelectKBest to find the best features to include in the Final Model. I used a For Loop to evaluate the hyperparameter optimized Random Forest Model, calculate the balanced_accuracy for the Training and Validation datasets, and store the values in a dataframe
I created a random subset from the Training dataset keeping the target distribution the same as in the full set. I then used the smaller dataset to hyperparameter optimize the models.
Model Performance and Interpretation
The Final Model selected is a Random Forest with 10 Trees, 139 estimators, a minimum of 10 samples required to split an internal node, balanced class weights and no bootstraping. The features in the Final Model have the following importances:
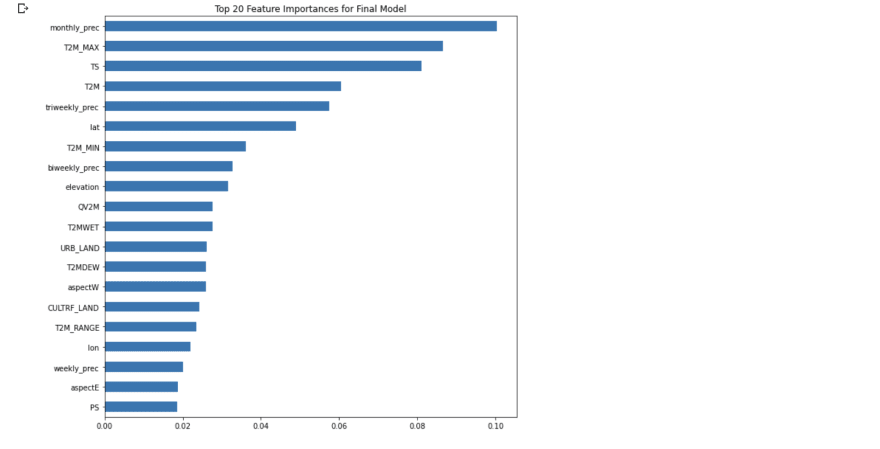
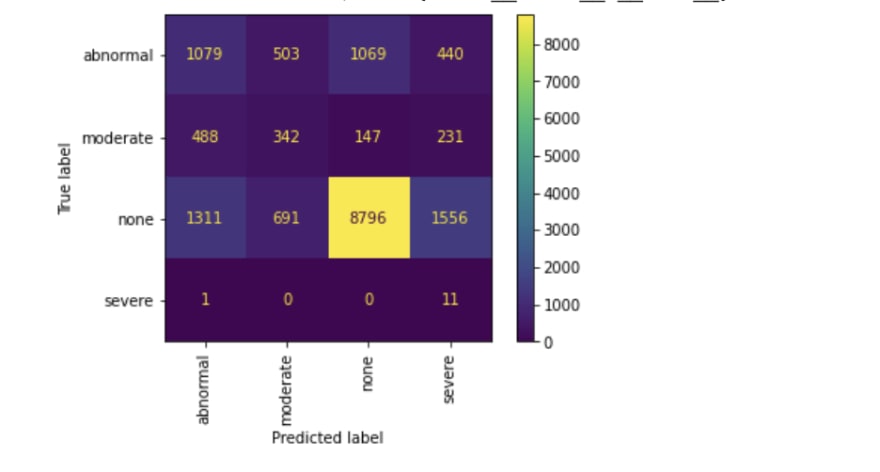
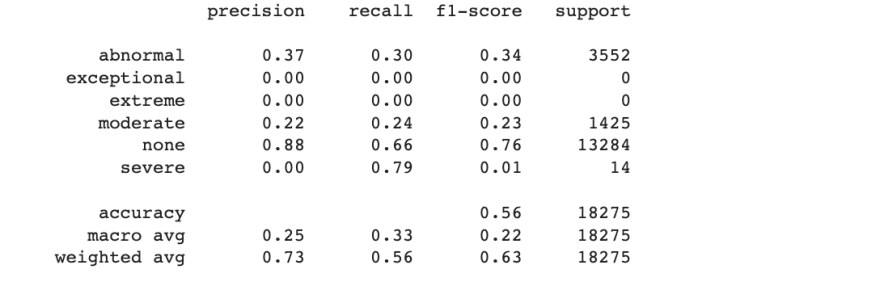
The confusion matrix and the classification reports are below


Latest comments (0)