There are many tools out there to help us measure performance metrics occurring on website page-load. Lighthouse, Pingdom, and WebPageTest to name a few (many tools use Lighthouse under the hood). Tooling targeted at measuring the performance of user interactions on websites after page-load is harder to find. The lack of tools may be due to how each site has its own unique requirements and user interactions. Therefore, the developer (you!), must tailor post-page-load, user-centric performance testing based on what your individual site requirements are.
I've been dabbling with building a testing framework that automates measuring the duration of certain user interactions on my website. My hope is this post provides a starting point to anyone who is considering doing the same with their own site.
What to Test
Possible areas to prioritize testing focus.
Changing routes in a SPA
- Navigating from a landing page to the page the user will likely visit next
Priority Interactions
- Login
- View Cart
- Open Navigation Menu
- Add a Like or Favorite
- Get Search Results
Define Baselines
After reading the article The Psychology of Web Performance and it's excerpt from Usability Engineering there are "3 important limits to keep in mind when optimizing web and application performance."
- A user feels a response is instantaneous at a .01 second.
- A user experiences uninterrupted flow with 1 second response times.
- Once response times exceed 10 seconds, user attention suffers breaking flow, and frustration rises.
When defining baselines to determine the success or failure of a test keep these limits in mind.
What Tools Will We Use?
Puppeteer - a headless browser Node.js library.
- Navigates to web pages
- Enables communication with Chrome Developer Tools Protocol
- Interacts with our pages as a user would
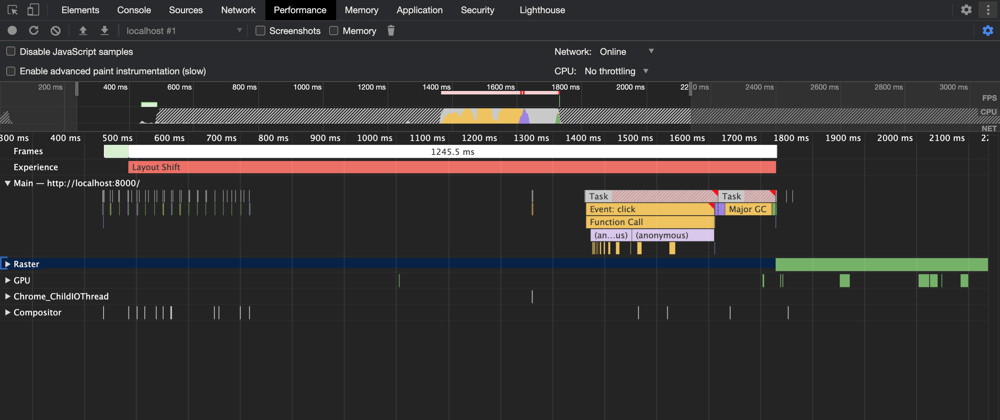
Chrome Developer Tools Performance Timeline - included with the Chrome web browser
- Enables recording of events occurring in the browser during page load or during user interactions
Process
Assuming you've already installed Node and Puppeteer, let's look at a starting point for your Node.js script taken from this blog post by Addy Osmani.
const puppeteer = require('puppeteer');

(async () => {
    const browser = await puppeteer.launch();
    const page = await browser.newPage();
    const navigationPromise = page.waitForNavigation();
    await page.goto('https://pptr.dev/#?product=Puppeteer&version=v2.1.1&show=outline');
    await page.setViewport({ width: 1440, height: 714 });
    await navigationPromise;
    const selector = 'body > sidebar-component > sidebar-item:nth-child(3) > .pptr-sidebar-item';
    await page.waitForSelector(selector);
    await page.tracing.start({ path: 'trace.json', screenshots: true });
    await page.click(selector);
    await page.tracing.stop();

    await browser.close();
})();
What you see above is the basic idea.
Start a new browser instance
Navigate to a URL
Start a trace (utilizes the Chrome Dev Tools Protocol to interact with the Performance Timeline tool)
Select an element on the page and click it
Stop the trace
Close the browser
The output of the trace file generated (trace.json) will look similar to the following only with many more entries.
// trace.json
{
    "traceEvents": [
        {
            "args": { "data": { "type": "click" } },
            "cat": "devtools.timeline",
            "dur": 7761,
            "name": "EventDispatch",
            "ph": "X",
            "pid": 61589,
            "tdur": 7706,
            "tid": 775,
            "ts": 161565081204,
            "tts": 119022
        },
        {
            "args": {
                "cat": "devtools.timeline,rail",
                "dur": 18,
                "name": "Paint",
                "ph": "X",
                "pid": 61589,
                "tdur": 18,
                "tid": 775,
                "ts": 161565160795,
                "tts": 196604
            }
        }
    ]
}
The trace file contains a traceEvents array. Each event object contains the values of
ts = time start;
dur = duration;
ts: The tracing clock timestamp of the event. The timestamps are provided at microsecond granularity.
There is an extra parameter dur to specify the tracing clock duration of complete events in microseconds.
All other parameters are the same as in duration events. The ts parameter indicate the time of the start of the complete event.
Unlike duration events, the timestamps of complete events can be in any order.
An optional parameter tdur specifies the thread clock duration of complete events in microseconds.
In order to accurately measure how long the user interaction has taken we need to analyze the trace file and identify the browser rendering events. This article by Paul Irish explains the browser's rendering process as the "Pixel Pipeline."
- User Interaction Event (often JavaScript or CSS Animations)
- Style
- Layout
- Paint
- Composite
We can find all of these events in the trace file generated by Puppeteer. If we follow the order of events of the "Pixel Pipeline" we should be able to determine the total duration of the rendering process initiated from the user interaction. Subtract the "User Interaction" event start time ("click" event in my example) from the sum of the start time of the final "Composite" event and the duration of the final "Composite" event.
const totalDuration = finalCompositeStartTime + finalCompositeDuration - clickStartTime;


Refinement
There are other modifications you can make to simulate users more realistically. Notably, simulating users on poor performing networks and CPU's. Puppeteer allows configuration of network and CPU throttling during the performance timeline traces.
// Connect to Chrome DevTools
const client = await page.target().createCDPSession();

//Set Network Throttling property
await client.send('Network.emulateNetworkConditions', {
    offline: false,
    downloadThroughput: (200 * 1024) / 8,
    uploadThroughput: (200 * 1024) / 8,
    latency: 20,
});

// Set  CPU Throttling property
await client.send('Emulation.setCPUThrottlingRate', { rate: 4 });
That's all there is to it! Utilizing this tooling and knowledge of the browser's rendering process we can create baselines, execute user interactions, and analyze the resulting timings. We now have a starting point to incorporate performance tests into a CI/CD pipeline.
Part 2 of this series we will look at an example project which follows the methodology in this post.


Top comments (0)