I saw this post
https://creon.substack.com/p/hot-or-not
And I decided to replicate it for myself using python and sqlite. I was born in the 60's so my personal statement is I am certain it is hotter now than when I was a kid.
So I went here to get data https://mesonet.agron.iastate.edu/request/download.phtml?network=TN_ASOS
And downloaded the data for TN near me. Mainly looking at air temperature.
From that I created a sqlite database and loaded the CSV.
CREATE TABLE data (
    station varchar,
    dt datetime,
    tmpf real,
    dewf real,
    relh real
)
.mode csv
.import asos.csv data
To make my life easier I made some new columns for year and month (to split out the date).
I then took the MAX temp for each day, the statement I am looking to validate is I think it is hotter now so MAX temp seems like a fine thing to use. Another reason for taking the MAX temp for each day is the data I am using has multiple measurements per day, I just need the MAX one for the day.
I made a 2nd table mainly to make my life easier.
create table mem_daily_max as select y,m,d,max(tmpf),max(dewf),max(relh) from data where station='MEM' group by y,m,d
Then I averaged the temp for each month since 1990 and plotted it. Different months show different trends like the summer months show less changes. Memphis in the summer has always been and continues to be so.
If you look at a winter month though the trend is clear.
The raw data for December from 1960 till now
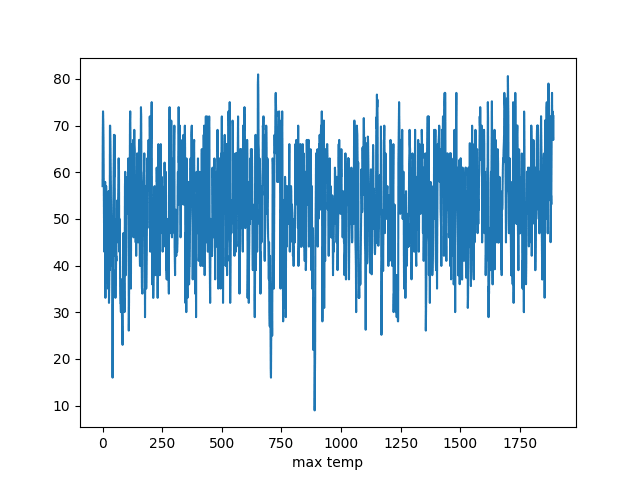
It is fairly hard to see much in that. The python code is below
import sqlite3

sql ="""
SELECT y,m,d,tmpf FROM
mem_daily_max WHERE m=12 AND y>1960
ORDER BY y,m,d ASC
"""

db = None
cur = None
try:
    db = sqlite3.connect("data.db")
    cur = db.cursor()
    cur.execute(sql)
    data = cur.fetchall()
finally:
    if cur is not None:
        cur.close()
    if db is not None:
        db.close()

pd = []
for (y,m,d,tmpf) in data:
    print(y,m,d,tmpf)
    pd.append(tmpf)

import matplotlib.pyplot as plt
plt.plot(pd)
plt.xlabel("max temp")
plt.savefig("foo.png")
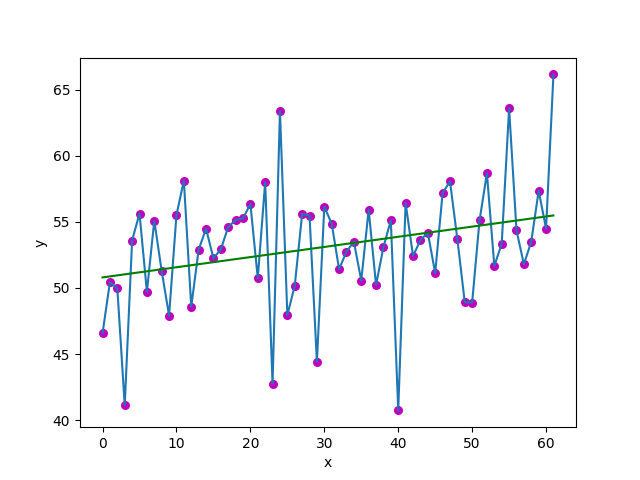
So I took the average for each month to smooth it and the chart below only looks at December.
The average for December with a linear regression line. Which it is fairly clear that the air temp is going up in December at least over my lifetime.
import sqlite3

sql ="""
SELECT y,m,avg(tmpf) as tmp FROM mem_daily_max
WHERE m=12 GROUP BY y,m ORDER BY y,m asc;
"""

# just used some code I found online for this function
def estimate_coef(x, y):
    # number of observations/points
    n = np.size(x)

    # mean of x and y vector
    m_x = np.mean(x)
    m_y = np.mean(y)

    # calculating cross-deviation and deviation about x
    SS_xy = np.sum(y*x) - n*m_y*m_x
    SS_xx = np.sum(x*x) - n*m_x*m_x

    # calculating regression coefficients
    b_1 = SS_xy / SS_xx
    b_0 = m_y - b_1*m_x

    return (b_0, b_1)

# just used some code I found online for this function
def plot_regression_line(x, y, b):
    # plotting the actual points as scatter plot
    plt.scatter(x, y, color = "m",
               marker = "o", s = 30)

    # predicted response vector
    y_pred = b[0] + b[1]*x

    # plotting the regression line
    plt.plot(x, y_pred, color = "g")

    # putting labels
    plt.xlabel('x')
    plt.ylabel('y')

    # function to show plot
    plt.savefig("goo.png")

db = None
cur = None
try:
    db = sqlite3.connect("data.db")
    cur = db.cursor()
    cur.execute(sql)
    data = cur.fetchall()
finally:
    if cur is not None:
        cur.close()
    if db is not None:
        db.close()

pd = []
for (y,m,tmp,) in data:
    pd.append(tmp)

# just plot the data
import matplotlib.pyplot as plt
plt.plot(pd)
plt.xlabel("max temp")
plt.savefig("foo.png")

# now run the regression
import numpy as np
x = np.array([i for i in range(len(pd))])
y = pd

b = estimate_coef(x,y)
print("Estimated coefficients:\nb_0 = {}  \
          \nb_1 = {}".format(b[0], b[1]))
plot_regression_line(x,y,b)


Top comments (0)