
Linear Regression is basically a used type of predictive analysis and one of the most simple algorithms in machine learning. It attempts to measure the relationship between variables by fitting a linear equation to observed data. For example, when the mobile phone's age increases, the price will go down. So, one variable is an explanatory variable (Age). Or otherwise, we can say it's an independent variable. And the other one is considered to be the dependent variable (Price).
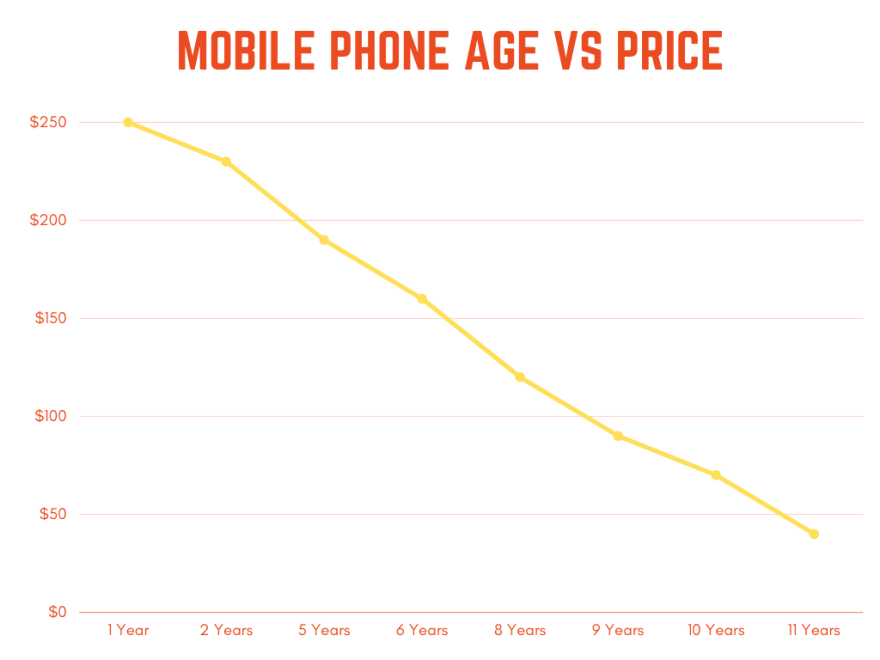
From that example, we can say the future price of the mobile phone using that observed data. Here is a table of the example data.
| Mobile Phone Age (Years) | Price ($) |
|---|---|
| 1 | 250 |
| 2 | 230 |
| 5 | 190 |
| 6 | 160 |
| 8 | 120 |
| 9 | 90 |
| 10 | 70 |
| 11 | 40 |
In this case, we see that a negative relationship between mobile phone age and price. Why do I say that, when the mobile phone's age increases, the price will decrease.
Another example is when experience increases, so do the salary. It's a positive relationship.
We're trying to predict the mobile phone's future prices given the age like this.
The question is what is the price after 7 years?. Let's put a point there to see how much it is.
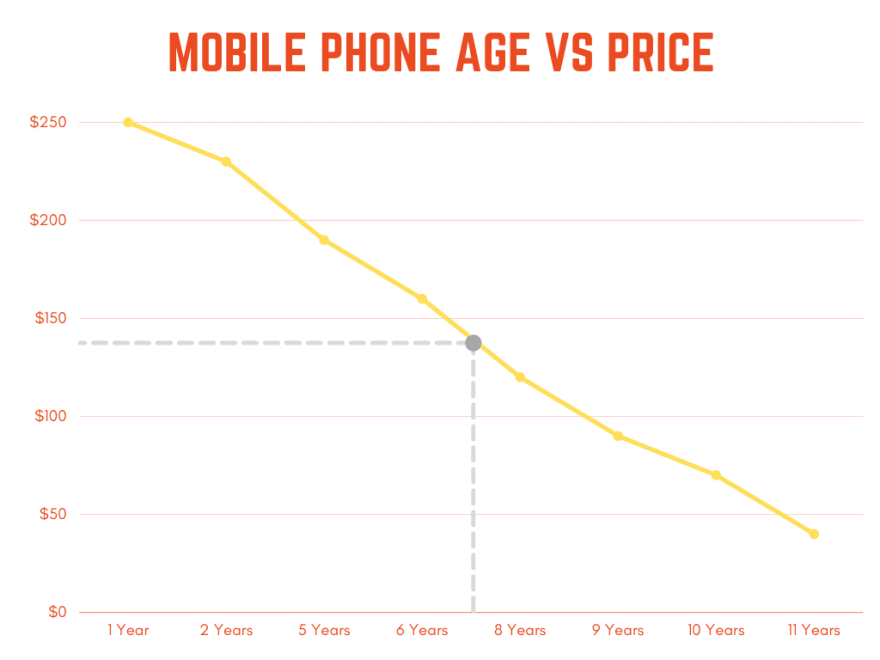
It's a little bit lower than one hundred and fifty usd. So, Now see the mathematical side behind simple linear regression. The formula is y = mx + b. I know you're a little bit familiar with this formula. because mostly we all learned this in school.
-
y- What we are going to predict. In this case, mobile phone price (dependent variable) -
m- Slope or constant -
x- Input as 7 years (independent variable) -
b- Intercept
And m and b are given by the following formula.


Find the linear regression equation for that mobile phone price data set.
| x (Years) | y (Price) | x2 | xy |
|---|---|---|---|
| 1 | 250 | 1 | 250 |
| 2 | 230 | 4 | 460 |
| 5 | 190 | 25 | 950 |
| 6 | 160 | 36 | 960 |
| 8 | 120 | 64 | 960 |
| 9 | 90 | 81 | 810 |
| 10 | 70 | 100 | 700 |
| 11 | 40 | 121 | 440 |
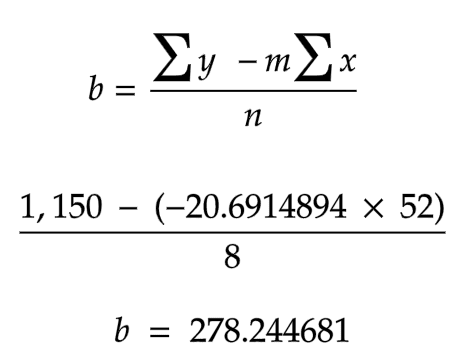
| (∑x) = 52 | (∑y) = 1,150 | (∑x2) = 432 | (∑xy) = 5,530 |
Okay, now we can assign those values to that formulas and get the value of m and b.
Find m - Slope

Find b - Intercept
Predict the mobile phone price after 7 years. using y = mx + b. The y is the price of the mobile phone after 7 years (that we're going to predict). x is 7 years.
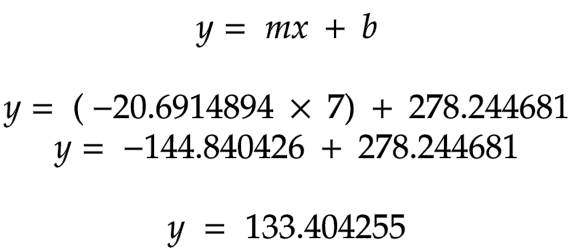
The mobile phone price after 7 years is 133.40 usd. Now do the same thing with scikit learn linear regression model using Python.
Linear Regression Model (Scikit Learn)
First, We have to save that data set into a csv file. To do that, create a new csv file as mobiledata.csv and add those data like this.

Let's code it! I'm using Jupyter Notebook. You can use any Python IDE as you prefer. Next, Install the libraries that we need. (If you are using Jupyter Notebook, add an exclamation mark before the command to act as if it is executed in the terminal)
!pip install scikit-learn
!pip install numpy
!pip install pandas
!pip install matplotlib
Import those libraries
import numpy as np
import pandas as pd
import matplotlib.pyplot as plt
from sklearn.linear_model import LinearRegression
Read the mobiledata.csv file using pandas
data_set = pd.read_csv('mobiledata.csv')
Create a chart and put the points there
plt.scatter(data.age, data.price, color='red')
plt.xlabel('Mobile phone Age')
plt.ylabel('Price')
You can see the chart like this.

Get the age values as x and price values as y. We need to convert those values to a numpy array.
x = np.array(data.age.values)
y = np.array(data.price.values)
Create a linear regression class object and train the model using the fit function. Also, the model.fit function allows a two-dimensional array to x position.
model = LinearRegression()
model.fit(x.reshape((-1,1)), y)
# x.reshape((-1,1) is convert numpy array to two dimensional array
We can find the best fit line for this data set if we want. And get the values of m (Slope) and b (Intercept).
plt.scatter(data.age, data.price, color='red')
plt.xlabel('Mobile phone Age')
plt.ylabel('Price')
m,b = np.polyfit(x,y,1)
plt.plot(x,m*x+b)

Finally, predict the mobile phone price after 7 years using the model. The model object is defined as model. Predict the price to see whether it's equal to the previously calculated value or not. To do that, We need to convert x value (7) to a numpy array and two-dimensional array.
year_seven = np.array([7]).reshape((-1,1))
# Predict the price
model.predict(year_seven)
You'll see the price after predict using the model is exactly the same as the previously calculated value that We using the formula.
# array([133.40425532])
You can check the values of m and b by executing the variable in the notebook.
m
# -20.691489361702125
b
# 278.2446808510638
Happy Coding🎉


Oldest comments (0)