
TerminusDB graph visualisation of Dublin Council voting data
Do you ever check to see the actual voting record of your preferred politician before you vote? Or, do you just vote for them because of their party affiliation? Do you think your local representative speaks for you on the issues that you care about?
Politics can be complicated, my friend, but data never lies. In this tutorial, we will use TerminusDB to show you how to analyse the voting behavior of politicians. For demonstration purposes we’ll use a dataset describing the voting records of Councillors in Dublin City Council, the birthplace of TerminusDB, retrieved from https://counciltracker.ie/, the cleaned data used in the tutorial can be downloaded here. (Thanks Dublin Inquirer for the great work — have to keep the politicians on their toes)
We’ll use WOQL, the web object query language, a powerful and highly composable graph query language, throughout the tutorial.
(We’re assuming you already have TerminusDB installed, but if you haven’t go to our quick start installation guide. It’s very easy to get started.)
Create a Database and a Schema
Create a Database in the +Create Database link on the left hand side of the terminus-console. You could call it dublin_council

Once it is created, go to the Query link on the left, and enter the following query:
WOQL.when(true).and(
        WOQL.doctype("Party")
            .label("Party")
            .description("Political Party"),
        WOQL.doctype("Representative")
            .label("Representative")
            .description("An elected member of the Dublin Council")
            .property("member_of", "Party")
            .label("Member of").cardinality(1),
        WOQL.doctype("Similarity")
            .label("Similarity")
            .property("similarity", "decimal")
            .label("Similarity")
            .property("similar_to", "Representative")
            .label("Similar To").cardinality(2)
   );
and click Submit
Have a quick check to make sure the schema is there. Click Schema in the left hand navigation bar and you should have:

And if you click the graph view button (circled in red), you should see:
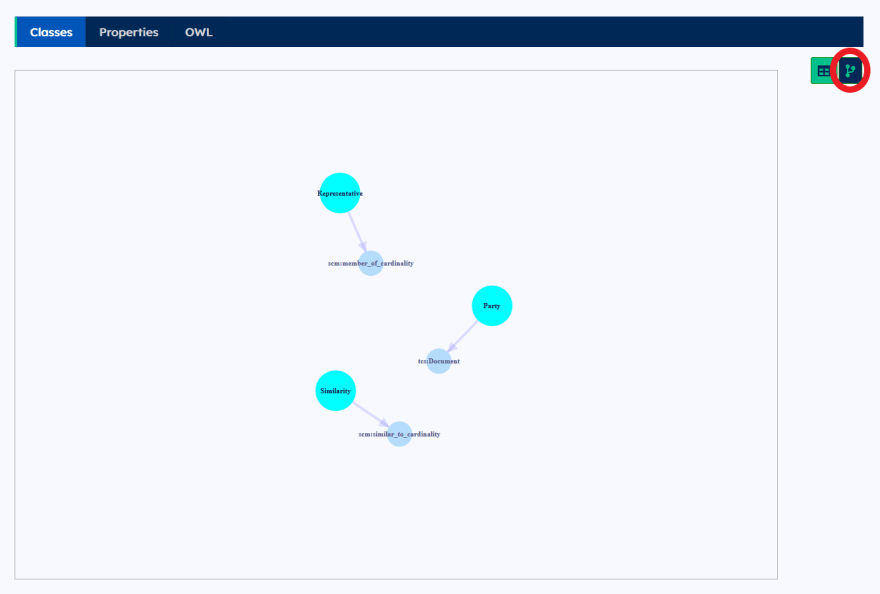
In the query above, we created 3 doctype: Party, Representative, Similarity. Regarding the property, Representative is the member of 1 Party, Similarity will consist of a decimal number and linking up 2 Representative. We created the schema using when().
Load in the Political Voting Data
As always, we need csv, wrangles and inserts to load in the data. We’re going to use the query to import the data, clean it and match it. As you might have seen in other TerminusDB tutorials, WOQL is a highly composable language, you can combine queries arbitrarily using logical ANDs and ORs.Make a new WOQL query as follow:
const csv = WOQL.get(
                WOQL.as("councillor_a","v:Rep_A")
                .as("councillor_b", "v:Rep_B")
                .as("party_a", "v:Party_A")
                .as("party_b", "v:Party_B")
                .as("distance", "v:Distance")
            ).remote("https://terminusdb.com/t/data/council/weighted_similarity.csv");
const wrangles = [
         WOQL.idgen("doc:Party", ["v:Party_A"], "v:Party_A_ID"),
         WOQL.idgen("doc:Party", ["v:Party_B"], "v:Party_B_ID"),
         WOQL.idgen("doc:Representative", ["v:Rep_A"], "v:Rep_A_ID"),
         WOQL.idgen("doc:Representative", ["v:Rep_B"], "v:Rep_B_ID"),
         WOQL.typecast("v:Distance", "xsd:decimal", "v:Similarity"),
         WOQL.idgen("doc:Similarity", ["v:Rep_A", "v:Rep_B"], "v:Rel_ID"),
         WOQL.concat("v:Distance Overall Similarity","v:Rel_Label"),
         WOQL.concat("v:Distance Overall Similarity between v:Rep_A and v:Rep_B", "v:Rel_Description")
];
const inserts = WOQL.and(
        WOQL.insert("v:Party_A_ID", "Party")
            .label("v:Party_A"),
        WOQL.insert("v:Party_B_ID", "Party")
            .label("v:Party_B"),
        WOQL.insert("v:Rep_A_ID", "Representative")
            .label("v:Rep_A")
            .property("member_of", "v:Party_A_ID"),
        WOQL.insert("v:Rep_B_ID", "Representative")
            .label("v:Rep_B")
            .property("member_of", "v:Party_B_ID"),
        WOQL.insert("v:Rel_ID", "Similarity")
            .label("v:Rel_Label")
            .description("v:Rel_Description")
            .property("similar_to", "v:Rep_A_ID")
            .property("similar_to", "v:Rep_B_ID")
            .property("similarity", "v:Similarity")
    )

const inputs = WOQL.and(csv, ...wrangles);
WOQL.when(inputs, inserts);
and click Submit
- In the csv we load in all the relevant columns of the csv and link them with a variable identified with v: using as()
- In the wrangles we have to do data wrangling operations, idgen() for creating id for fields and typecast() to cast the Distance column in to a decimal objects as Similarity
- Our inputs are now ready (created by csv and wrangles)
- In the inserts, we actually slot the objects in, the variables created in the wrangles will be insert() with an id. We can also add label(), descriptions() and property()
- Load the data using another when()
With the data in TerminusDB, you can now click on the documents and explore. It should look like this:

You can then click on a party to explore further — click on the Green Party for example and you can see their members:

Then click on Patrick Costello and you get his similarity scoring with the other members of the council:

You can quickly see the similarities across the Councillors. Substituting products for people, it’s easy to see how a similar process could build a recommendation engine for e-commerce or another service. We’ll put those additional steps in the next TerminusDB tutorial.
Click on one of the others at random and you get this:

That is a high similarity score (0.854) for Councillors from different parties (Rebecca Moynihan is in the Labour Party).
Extra: Check out how to Load your local files in TerminusDB
Query and Visualisation
Now with the schema and data in place, we can build some queries and visualise the outputs as a graph. First we have to create a query (of course):
WOQL.limit(1000).and(
    WOQL.triple("v:Subject","similar_to","v:Value"),
    WOQL.triple("v:Subject","similar_to","v:Value2"),
    WOQL.triple("v:Subject","similarity","v:Similarity"),
    WOQL.triple("v:Value","member_of","v:Party"),
    WOQL.triple("v:Value2","member_of","v:Party2"),
    WOQL.not().eq("v:Value","v:Value2"),
    WOQL.opt().triple("v:Value2","label","v:Lab2"),
    WOQL.opt().triple("v:Value","label","v:Lab1"),
    WOQL.eval(WOQL.divide(1, WOQL.exp("v:Similarity", 4)), "v:Distance")
)
and click Submit
- We use
WOQL.limiti(1000).andto limit the result set and shorten the query time (we’ll show the full scaled up results later) - This query only uses
triple()notquad()we are only extracting data from a single database (includingquad()allows you to specify which databases you want to extract data from) - Use
opt()to ignore the missing objects (instead of returning an error) - Use
eval()to execute arithmetic calculation (divide()andexp()) and store it to variableDistance, this variable is calculated fromSimilarty.
You will now have results in a tabular form below the query:

It is hard to make sense out of the result! But at least we see we have results from our query.
To make a graph visualisation, click on the graph button (the right most of the 3 at the top right of the table):

Wow! What is this madness! As we have show everything from the query: every object, every property, label, description… things are a little too busy to make visual sense.
We need to customize the view of the graph. Click on the left most button of the 3 at the top right, you will see an extra input field for the view:

Replace everything with our customised view script:
view = View.graph();
view.node("v:Subject", "v:Lab2", "v:Lab1", "v:Party2", "v:Party", "v:Similarity", "v:Distance").hidden(true)
view.node("v:Similarity").hidden(true)
view.edge("v:Value", "v:Value2").distance("v:Distance").text("v:Distance").weight(0.04)
view.node("v:Value").text("v:Lab1").icon({ label: true})
view.node("v:Value2").text("v:Lab2").icon({ label: true})
view.node("v:Value", "v:Value2").charge(-999).collisionRadius(10)
Click Update view
- We hidden() some node()
- Customize the edge() to have the distance() equal to the variable Distance and have a equal weight() of 0.04. It will also show the value of Distance when mouse on
- Replace the icon() with the label() of Lab, which is the name of the politicians.
- charge() and collisionRadius() makes the nodes have a natual seperation with each other (avoid clustering) for easier viewing.
💥now we have a much nicer graph:

But wait, are we missing something? Oh, the party of the politicians, let’s colour code the politicians to their party so we can make easy sense of the graph. Let’s edit the view again with this script:
view = View.graph();
view.node("v:Subject", "v:Lab2", "v:Lab1", "v:Party2", "v:Party", "v:Similarity", "v:Distance").hidden(true)
view.node("v:Similarity").hidden(true)
view.edge("v:Value", "v:Value2").distance("v:Distance").text("v:Distance").weight(0.04)
view.node("v:Value").text("v:Lab1").icon({ label: true})
view.node("v:Value2").text("v:Lab2").icon({ label: true})
view.node("v:Value", "v:Value2").charge(-999).collisionRadius(10)
view.node("v:Value").v("v:Party").in("doc:PartySolidarity").color([5, 25, 22])
view.node("v:Value2").v("v:Party2").in("doc:PartySolidarity").color([5, 25, 22])
view.node("v:Value").v("v:Party").in("doc:PartySocial%20Democrats").color([25, 25, 225])
view.node("v:Value2").v("v:Party2").in("doc:PartySocial%20Democrats").color([25, 25, 225])
view.node("v:Value").v("v:Party").in("doc:PartySinn%20F%C3%A9in").color([25, 225, 25])
view.node("v:Value2").v("v:Party2").in("doc:PartySinn%20F%C3%A9in").color([25, 225, 25])
view.node("v:Value").v("v:Party").in("doc:PartyLabour%20Party").color([255, 0, 0])
view.node("v:Value2").v("v:Party2").in("doc:PartyLabour%20Party").color([255, 0, 0])
view.node("v:Value2").v("v:Party2").in("doc:PartyFine%20Gael").color([0, 0, 255])
view.node("v:Value").v("v:Party").in("doc:PartyFine%20Gael").color([0, 0, 255])
view.node("v:Value").v("v:Party").in("doc:PartyFianna%20F%C3%A1il").color([100, 200, 100])
view.node("v:Value2").v("v:Party2").in("doc:PartyFianna%20F%C3%A1il").color([100, 200, 100])
view.node("v:Value").v("v:Party").in("doc:PartyGreen%20Party").color([25, 225, 125])
view.node("v:Value2").v("v:Party2").in("doc:PartyGreen%20Party").color([225, 225, 125])
view.node("v:Value").v("v:Party").in("doc:PartyIndependent").color([25, 25, 25])
view.node("v:Value2").v("v:Party2").in("doc:PartyIndependent").color([25, 25, 25])
view.node("v:Value").v("v:Party").in("doc:PartyPeople%20Before%20Profit").color([225, 25, 25])
view.node("v:Value2").v("v:Party2").in("doc:PartyPeople%20Before%20Profit").color([225, 25, 25])
view.node("v:Value").v("v:Party").in("doc:PartyWorkers'%20Party").color([225, 225, 225])
view.node("v:Value2").v("v:Party2").in("doc:PartyWorkers'%20Party").color([225, 225, 225])
Now the script is a bit long, but it is not complicated. For example, if the politician has Party equal to PartyGreen Party (%20 for white space), colour the node [225, 225, 125] which is light green (matching the colour code from the source website):

The same also apply to Lab2 and Party2 (and they are just the parallel image of Lab and Party).
Now let’s try to see the whole picture by removing the limit(1000) from our query and click submit. (Warning: you need memory for handling the graphics and it might take a few seconds to load).
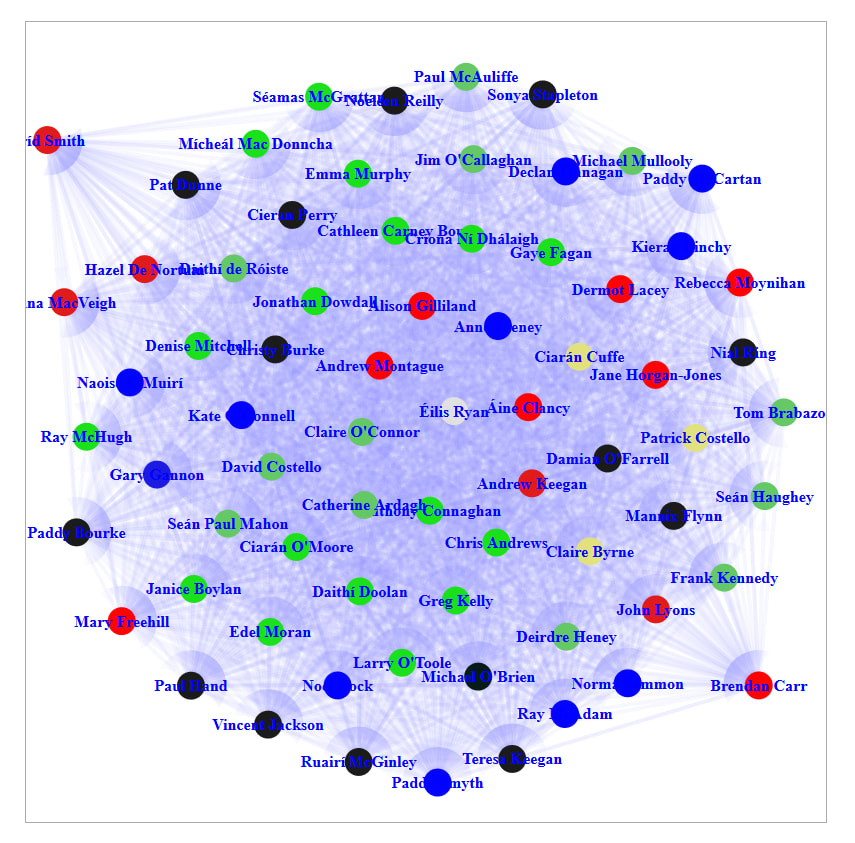
There are some really interesting conclusions we can quickly draw from viewing the data in this way. Specifically, the data allows us to draw the following conclusions:
- Political parties do tend to vote in a reasonably homogeneous fashion (the distribution is not random, or anything close to it)
- Sinn Fein enjoy the strongest disciplinary record in terms of council votes, with all Councillors clustered closely together
- Fine Gael and Fianna Fail are heavily inter-mingled, to the extent that they could almost be considered a single party
- The same could be said for the Green Party and Labour Party, who present as a single block in this analysis
These results are interesting in and of themselves. But in addition, the visualisation of data in this way enables us to see a continuum across the political spectrum, and accurately place parties on that spectrum based on real data rather than perception or prejudice.
Lastly this data shows clearly the politics of any given independent just by looking which parties they are situated with. A few independents seem to occupy an equivalent status to Sinn Féin or Fianna Fáil-Fine Gael. A few hover around the Solidarity-People-Before Profit-Workers’ Party nexus. However, the voting positions of the Greens and Labour are not apparently so popular with the unaffiliated.
Now it is your turn. Change the parameters in the view script to play around and mix things up.
One more thing to do is to analyse different dataset. Here is some open data from the US Congress that you can play around, and a quick WOQL query to build the schema:
WOQL.when(true).and(
        WOQL.doctype("Party")
            .label("Party")
            .description("Political Party"),
        WOQL.doctype("Representative")
            .label("Representative")
            .description("An elected member of the US congress")
            .property("member_of", "Party")
                .label("Member of").cardinality(1),
        WOQL.doctype("Similarity")
            .label("Similarity")
            .property("similarity", "decimal")
                .label("Similarity")
            .property("similar_to", "Representative")
                .label("Similar To").cardinality(2),
        WOQL.add_class("ArmedForcesSimilarity")
            .label("Armed Forces")
            .parent("Similarity"),
        WOQL.add_class("CivilRightsSimilarity")
            .label("Civil Rights")
            .parent("Similarity"),
        WOQL.add_class("HealthSimilarity")
            .label("Health")
            .parent("Similarity"),
        WOQL.add_class("ImmigrationSimilarity")
            .label("Immigration")
            .parent("Similarity"),
        WOQL.add_class("InternationalAffairsSimilarity")
            .label("International Affairs")
            .parent("Similarity"),
        WOQL.add_class("TaxationSimilarity")
            .label("Taxation")
            .parent("Similarity"),
        WOQL.add_class("OverallSimilarity")
            .label("Overall")
            .parent("Similarity")
   )
And a WOQL to get some of that data into your database (this is a larger data set so it’ll take a little longer to return — took a little over 400 seconds last time I ran it):
const csv = WOQL.get(
                WOQL.as("politician_a","v:Rep_A")
                .as("politician_b", "v:Rep_B")
                .as("party_a", "v:Party_A")
                .as("party_b", "v:Party_B")
                .as("distance", "v:Distance")
            ).remote("https://terminusdb.com/t/data/congress/armed_forces_weighted_similarity.csv");
const wrangles = [
         WOQL.idgen("doc:Party", ["v:Party_A"], "v:Party_A_ID"),
         WOQL.idgen("doc:Party", ["v:Party_B"], "v:Party_B_ID"),
         WOQL.idgen("doc:Representative", ["v:Rep_A"], "v:Rep_A_ID"),
         WOQL.idgen("doc:Representative", ["v:Rep_B"], "v:Rep_B_ID"),
         WOQL.typecast("v:Distance", "xsd:decimal", "v:Similarity"),
         WOQL.idgen("doc:ArmedForcesSimilarity", ["v:Rep_A", "v:Rep_B"], "v:Rel_ID"),
         WOQL.concat("v:Distance Armed Forces Similarity","v:Rel_Label"),
         WOQL.concat("v:Distance Armed Forces Similarity between v:Rep_A and v:Rep_B", "v:Rel_Description")
];
const inserts = WOQL.and(
        WOQL.insert("v:Party_A_ID", "Party")
            .label("v:Party_A"),
        WOQL.insert("v:Party_B_ID", "Party")
            .label("v:Party_B"),
        WOQL.insert("v:Rep_A_ID", "Representative")
            .label("v:Rep_A")
            .property("member_of", "v:Party_A_ID"),
        WOQL.insert("v:Rep_B_ID", "Representative")
            .label("v:Rep_B")
            .property("member_of", "v:Party_B_ID"),
        WOQL.insert("v:Rel_ID", "ArmedForcesSimilarity")
            .label("v:Rel_Label")
            .description("v:Rel_Description")
            .property("similar_to", "v:Rep_A_ID")
            .property("similar_to", "v:Rep_B_ID")
            .property("similarity", "v:Similarity")
    )

const inputs = WOQL.and(csv, ...wrangles);
WOQL.when(inputs, inserts);
Feel free to use any open data to do the same analysis — we’d love to see the results. In fact, TerminusDB is running a competition on UK political data. Check it out over on twitter.


Top comments (0)