Implementing and verifying analytics on mobile devices is rarely favored by developers and often becomes a source of bugs and misleading data. The main problem is the tools to verify the correctness and to handle regressions.
We took common solutions to this problem and ranked them by 2 criteria - how easy it is to integrate the solution and how easy it is to use it frequently. For example grepping logs is easy to setup but annoying to use on a daily basis and building your own mobile debugger is hard to introduce (and support), but pleasant to use.
Given the situation, we decided to utilize the power of Avo and make the perfect mobile debugger. Fortunately, we already had experience building a similar product for the web, our customer-loved web debugger, from which we took inspiration.
Today we are introducing the Avo Mobile Debugger as open source SDKs for Android, iOS and React Native as a solution to the above problem. Use the debuggers to make your mobile analytics more robust, faster to implement and easier to test and your developers happier.
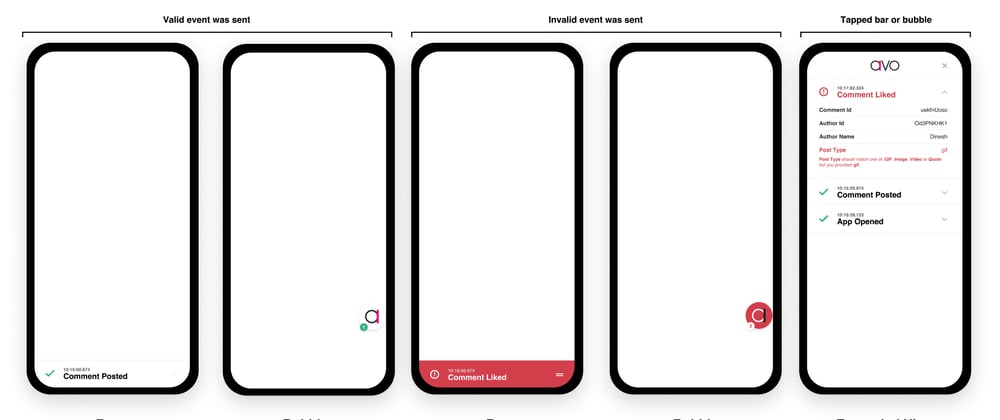
The integration is straightforward - libraries are distributed through most popular channels and integrated in Avo with a couple of lines of code. After that Avo sends all the events through the linked debugger in real time and you can easily see every event inside your app, no need to check the logs, network requests or tracking website. You can access the list of analytics events, see all properties of each event and the order of sending. Other features include toggling the debugger on and off, dragging the debugger view so it does not interfere with the interface and changing the look of it.
And one more thing, the debugger allows direct event posting and has no dependency on Avo. You can send additional data alongside Avo or use the debugger as a standalone library to visualize any kind of information.
How to enable the debugger
The following pseudocode would give you the idea, head to platform docs for specific integration instructions.
Create the debugger
JavaScript
val debugger = Debugger()
Pass the debugger when you initialize Avo
JavaScript
Avo.initAvo(Avo.AvoEnv.DEV, debugger)
Show the debugger
JavaScript
debugger.showDebugger(this, DebuggerMode.bar)
Pass debugger to Avo, so Avo can show all tracked events
JavaScript
Avo.initAvo(AvoEnv.DEV, myCustomDestination, debugger)
Post your own events
JavaScript
debugger.post(
   timestamp,
   "EventName",
   errors: [{propertyId:"id0", message:"error in property 'event prop' with id 'id0'"}],
   eventProperties: [{id:"id0", name:"event prop", value:"val"}],
   userProperties: [{id:"id1", name:"user prop", value:"val"}]
);
Platform specific repositories and integration docs
We store platform docs in the corresponding github repositories.
The mobile debugger is available to everyone as of today, check out the docs, and happy coding!


Top comments (0)