Istio service mesh allows you to add key capabilities like observability, security, and traffic management to your applications without having to make any change in your code or configuration. Discover how Istio monitoring can help you guarantee your Istio services are in a good shape.
In this article, we’ll talk about basic Istio concepts. You’ll find out which are the most interesting metrics for Istio monitoring. In addition, we’ll walk you through the set of tools you need to manage Istio and inspect what’s under the hood.
These are the topics covered in this article:
- What is Istio?
- Istio overview
- How to monitor Istio with Prometheus
- Grafana dashboards for Istio
- What is Kiali?
- What is Jaeger?
What is Istio
Istio service mesh is a dedicated infrastructure layer that you can add transparently to your applications. This new layer adds extra capabilities to the infrastructure, allowing you to manage the traffic between your microservices. You can create your own rules to balance the traffic based on your preferences, implement fault injection rules to apply chaos engineering to your code, and much more.
Istio service mesh is made up of many different components, split into two layers:
- Control plane
- Data plane
Due to the complexity of Istio and its whole ecosystem, monitoring Istio can be a challenging task. Istio service mesh users cannot lose sight of what’s happening with their services, otherwise, they could end up having performance or availability issues on their applications.
What if some of the Istio service mesh control plane components start failing?
What if one of the Envoy sidecars doesn’t perform well?
How important is it to detect these and other kinds of issues in time by using Istio service mesh in Kubernetes?
Learn more about how Istio monitoring can help you prevent problems with Istio control plane, services, and workloads.
Istio overview
These are some of the features that the Istio control plane provides:
- Load balancing for HTTP, gRPC, WebSocket, and TCP traffic.
- Control flow mechanism of traffic behavior, by implementing rich routing rules, fault injection, failovers, etc. Configure your own circuit breaker rules to create resilient applications.
- Logs, traces, and metrics of your Istio service mesh.
- Secured communication between services with TLS encryption, authentication, and authorization.
In this section, you’ll learn more about the Istio control plane and data plane, the services and components included in Istio, and its responsibilities.

Istio control plane
Istiod is the name for the Istio service mesh control plane. It consists of the following components:
- Pilot: This is the component responsible for configuring the proxies at runtime. It propagates new configurations to Istio objects through the Envoy proxy.
- Citadel: Issues certificates and ensures its rotation. It acts as an internal CA (Certificate Authority), signing the certificate signing requests (CSR) and issuing TLS certificates ensuring the traffic between services is secured.
- Galley: Validates and distributes configurations in the Istio service mesh. After validation, configurations are sent to Pilot for distribution.
Istio data plane
Envoy is a data plane component in the Istio service mesh architecture. It is not part of the control plane, but its role is key to make Istio service mesh work. Envoy is a proxy that is collocated in pods (as a sidecar container), along with the original container. This sidecar proxy is responsible for handling traffic between services in the cluster, and from internal to external services.
Without Envoy it wouldn’t be possible to propagate changes, establishing communication from one service to others in the service mesh. In short, nothing would work.
Istio observability
We have talked about the Istio control plane and data plane, so far so good. But…
What about monitoring this infrastructure?
It seems like a complex environment, with lots of possibilities, so which tools should you use to monitor the Istio service mesh?
Let’s shed light on these questions!
In the following paragraphs you will learn more about the out-of-the-box observability stack for Istio.
Grab a pen and paper and let’s get started! 📝
The Istio service mesh observability stack is basically made up of four components:
- Prometheus: The open source monitoring tool that collects and stores metrics as time series data, widely adopted and supported by the community.
- Grafana: Like Prometheus, widely adopted and worldwide supported by the open source community. Grafana connects to data sources and represents time series data in graphs, easy to consume, configure, and allows users to export/import dashboards.
- Kiali: The Istio service mesh console. You’ll be able to monitor and check traffic flows, configure rich rules, circuit breakers, load balancers, and more.
- Jaeger: A distributed tracing platform. In addition to what the other tools offer, Jaeger allows you to analyze network performance and optimize latencies.
How to monitor Istio with Prometheus
Istio brings a bundle of addons. While these components are not necessary for running the Istio infrastructure, they are highly recommended. By deploying this bundle, you will acquire the observability module.
How can you deploy the observability stack?
It is really easy, just follow the next steps.
The first is to deploy the observability bundle that comes with the Istio release of your choice. Wait for a few minutes to have all the pods up and running, and… that’s all!
⚠️ The following instructions and configurations have been tested with Istio 1.15 in a Kubernetes 1.25 environment. For further information on how to deploy Istio, refer to the official Istio documentation page.
$ kubectl apply -f istio-1.15.0/samples/addons
$ kubectl get pods -n istio-system
NAME                                   READY   STATUS    RESTARTS   AGE
grafana-56bdf8bf85-fsdl5               1/1     Running   0          4m
istio-egressgateway-564bdb69c7-vpxnd   1/1     Running   0          4h
istio-ingressgateway-984565b57-b5f6m   1/1     Running   0          4m
istiod-6b5cbd4c58-z79qt                1/1     Running   0          4m
jaeger-c4fdf6674-8pv8m                 1/1     Running   0          4m
kiali-5ff49b9f69-l898z                 1/1     Running   0          4m
prometheus-85949fddb-grnnp             2/2     Running   0          4m
Once the pods are in Running state, we can access the Prometheus dashboard. You can use the istioctl command to forward the port, enabling the access on localhost.
$ istioctl dashboard prometheus
http://localhost:9090
In the Prometheus console, you can execute your own queries to get any of the Istio data metrics you may need.

Cool! But…
What are the key metrics you should check and monitor?
Let’s take a look at metrics in the next section. 🔍
Prometheus Istio key metrics
Istio exports a huge number of metrics. You would need a lot of time, paper, and ink to talk about all these metrics, so let’s try to highlight which are most important and why.
Envoy metrics
As discussed in previous sections, Envoy proxy is the component in charge of managing the traffic between services, and from internal to external services and clients. Monitoring the envoy metrics, you’ll better understand how your applications are performing and most importantly, you’ll notice if there is a potential issue somewhere within your Istio service mesh.
-
istio_requests_total: A counter that is incremented every time a HTTP, HTTP/2, or gRPC request is handled by an Istio proxy. This metric indicates the amount of traffic your infrastructure is processing. Watch out for changes in this metric since it may indicate traffic loss or problems in some part of the circuit if the counter dropped significantly. In the event of increasing the numbers, it may indicate the traffic has grown. Watch out for having enough capacity in your cluster. -
istio_request_duration_miliseconds: It provides three “counter” metrics (_bucket, _count, _sum) to measure the time that HTTP, HTTP/2, or gRPC requests need to be processed through the Envoy proxy. This metric is a good indicator of performance problems in your application workflow. Higher values than expected or sudden rises in request duration might indicate many different underlying issues, like network latencies, some applications behaving differently or performing poorly because of a new application version, etc. -
istio_request_bytes: Three “counter” metrics (_bucket, _count, _sum), which measures the HTTP, HTTP/2, or gRPC requests body size. -
istio_response_bytes: Three “counter” metrics (_bucket, _count, _sum), which measures the HTTP, HTTP/2, or gRPC response body size.
Pilot metrics
Pilot metrics reflect the number of changes and the time needed to propagate configuration changes to Istio components. Drastic changes or an ascendent trend on the values of these metrics might indicate problems while propagating new configurations or modifications to Istio objects.
-
pilot_xds: This is a “gauge” metric that indicates the number of endpoints connected to a pilot using xDS (a group of APIs that make up Discovery Service). -
pilot_xds_pushes: “Counter” metric to show the number of messages and the errors sent to the Listener Discovery Service (LDS), the Route Discovery Service (RDS), the Endpoint Discovery Service (EDS), and the Cluster Discovery Service (CDS). -
pilot_xds_push_time: Total time in seconds pilot takes to push messages to LDS, RDS, EDS, and CDS.
Galley metrics
These metrics will give you an estimation on the number of changes being applied to Istio objects. If a new manifest is applied for changing a Istio object, and the validation webhook validates it correctly, then it will count as a passed. If the validation webhook doesn't accept the manifest for some reason, it will be counted as a failed validation.
-
galley_validation_failed: A “counter” that measures the number of resource validation failed. -
galley_validation_passed: A “counter” that measures the number of resource validation passed.
Citadel metrics
Citadel metrics will provide an overview on whether the CSR coming to Citadel are being properly accepted, signed, and issued in the form of certificates.
-
citadel_server_csr_count: The number of CSR received by the Istio Citadel component. -
citadel_server_root_cert_expiry_timestamp: The UNIX timestamp in seconds, when Citadel root certificate will expire. -
citadel_server_success_cert_issuance_count: The number of certificates issued that Citadel has served successfully.
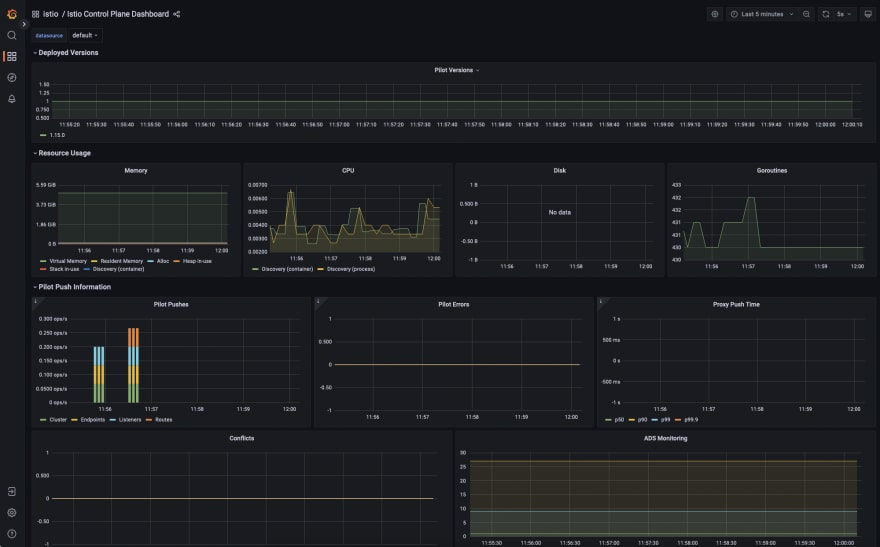
Grafana dashboards
It’s time to talk about Grafana.
Grafana is one of the components included in the Istio observability bundle. You can use it to display the Istio monitoring data thanks to the predefined dashboards included in the observability stack.
You can access Grafana UI the same way you did the Prometheus console.
$ istioctl dashboard grafana
http://localhost:3000
Kiali
Kiali is the console for Istio service mesh. Its UI is quite versatile, offering a lot of possibilities to manage and observe your services, like:
- Examine topology for your Istio service mesh applications.
- Observe the health of each service under the service topology.
- Get details on the network response time, how the load balancing engine is performing, application response codes, etc.
- Application versioning and how each version is performing.
- Create, delete, and modify Istio objects like Gateways, Sidecars, Services, etc.
Let’s open communication to the Kiali console:
$ istioctl dashboard kiali
http://localhost:20001/kiali
This is how Kiali represents the application topology as a graph. You will observe different sets of data, depending on which object you click on. For example, if you want to see data related to how the reviews application and its versions are performing, you will click on that item and all the relevant data will show up.
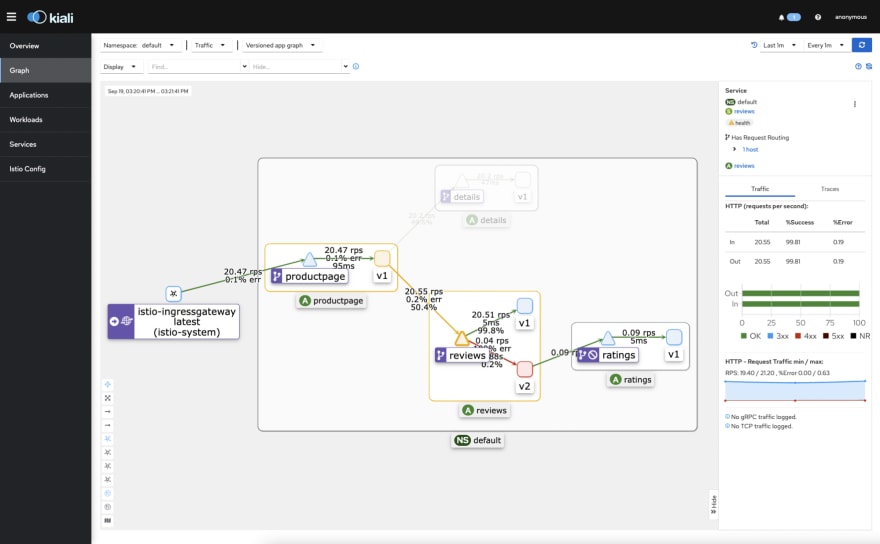
As we mentioned earlier, Kiali is not only an observability system, but also the Istio service mesh console. So, if you need to modify or even create an Istio object (Gateways, Services, Sidecars, etc.) you can do it from the “Istio Config” section in the console.

Jaeger
Jaeger is an open source software used for distributed tracing. Its mission is to trace transactions between distributed systems. Jaeger helps you with log traces, following the path of a certain transaction. It provides a visual mechanism to represent which way a transaction went, and valuable information like errors, response times, HTTP response codes, among others.
It’s time to inspect what Jaeger is and how to interact with its console.
$ istioctl dashboard jaeger
http://localhost:16686
Select in the search menu the service you want to inspect and click on “Find Traces”. You can customize the time frame you want to look in, or even use tags to make a more granular search.

Select the trace you want to inspect and navigate through the calls you will find in the tree. Data is represented by a timeline graph, where it is easy to identify every call that makes up the whole workflow and how much time was needed to process every operation. This way, you will easily spot potential issues in your applications and services. For example, you can detect which component is the culprit for taking two times longer to complete the whole transaction after a change in the code.

Conclusion
Istio provides a good toolset for monitoring the whole stack. These tools are not installed by default, and are not mandatory for having Istio working properly. They are highly recommended, though.
If you want to make sure everything is in a good shape in Istio, consider using the observability stack. It will help you monitor and manage objects in the Istio service mesh.
In addition to what you read in this article, would you like to have a tool that helps you with Istio service mesh troubleshooting?
Sysdig Monitor can assist with this hard mission. The out-of-the-box dashboards, and its exclusive tools, will help you monitor and troubleshoot your Istio service mesh from a single and unified portal, with a scalable platform managed by Sysdig.
Discover what Sysdig Monitor brings to monitor Istio service mesh, and how it can help you troubleshoot issues in real time with Sysdig Monitor!
If you want to learn more about how Sysdig Monitor can help with monitoring and troubleshooting your Kubernetes clusters, visit the Sysdig Monitor trial page and request a 30-day free account. You will be up and running in minutes!


Latest comments (0)