
The Syncfusion WPF Charts control is optimized to visualize a huge volume of data elegantly. Its rich feature set includes functionalities like data binding, multiple axes, legends, animations, data labels, annotations, trackballs, tooltips, gradients, technical indicators, zooming, and more.
In this article, we’ll see how to load data from different data sources in the WPF Charts control.
Before proceeding, you need to know three essential properties of the WPF Charts to configure the data:
- ItemsSource: Collects the data points used to generate the chart.
- XBindingPath: A bindable property that gets the property path of x-axis data in ItemsSource to render the chart series.
- YBindingPath: A bindable property that gets the property path of y-axis data in ItemsSource to render the chart series.
Let’s get started!
Key data sources
Syncfusion WPF Charts offers over 45 chart types. All the chart types support loading data from the following data sources:
Load IEnumerable data in WPF Charts
Let’s start with the IEnumerable data source. It supports all non-generic data collections that can be enumerated.
Here, we’ll populate the data collection with predefined class properties and specify the x-axis and y-axis adaptive fields to our WPF Charts control’s XBindingPath and YBindingPath, respectively. In addition, we’ll use the following data collection types in the IEnumarable data source:
- List
- ObservableCollection
- Dictionary
Let’s see how to populate IEnumarable data for the WPF Charts control:
- Create an object (Patient) for data creation. Here, we are going to load data in the form of patients’ names and height details in the chart.
public class Patient
{
    public Patient(string currentName, double currentHeight)
    {
        Name = currentName;
        Height = currentHeight;
    }

    public string Name { get; set; }

    public double Height { get; set; }
}
2.Create a ViewModel class for the patient details.
public class PatientViewModel
{
   public PatientViewModel()
   {
       PatientData = new ObservableCollection<Patient>();

       PatientData.Add(new Patient("Johnson Godwin", 176));
       PatientData.Add(new Patient("Peter Jackman", 163.3));
       PatientData.Add(new Patient("James Oliver", 177));
       ..

       PatientDetails = new Dictionary<string, double>();
       PatientDetails.Add("Johnson Godwin", 176);
       PatientDetails.Add("Peter Jackman", 163.3);
       …
   }

   public ObservableCollection<Patient> PatientData
   {
       get;
       set;
   }

   public Dictionary<string,double> PatientDetails
   {
       get;
       set;
   }
}
3.Bind the list data collection to the ItemSource property of the chart.
< Chart:SfChart>
  …
  < chart:ColumnSeries ItemsSource=”{Binding PatientData}” XBindingPath=”Name” YBindingPath=”Height” />

</Chart:SfChart>
4.Or, bind the dictionary data collection to the ItemSource property.
< Chart:SfChart>
  …
  < chart:ColumnSeries ItemsSource=”{Binding PatientDetails}” XBindingPath=”Key” YBindingPath=”Value” />

</Chart:SfChart>
The resulting chart is shown in the following image.

We can also populate our Charts with the following data collection types:
Load DataTable in WPF Charts
The next data we’ll try is a DataTable collection, which provides a collection of columns and rows to store data in grid form. We’ll assign the column names to our Charts control’s XBindingPath and YBindingPath properties.
Let’s see how to configure a DataTable collection in WPF Charts:
- Create a DataTable business object. In this example, we are going to load data for product sales and target details.
ChartDataTable = new DataTable();

ChartDataTable.Columns.Add("Product", typeof(string));
ChartDataTable.Columns.Add("Percentage", typeof(double));

ChartDataTable.Rows.Add("Data Cable", 65);
ChartDataTable.Rows.Add("Charger", 60);
ChartDataTable.Rows.Add("Smartwatch", 75);
ChartDataTable.Rows.Add("Earphone", 80);

ChartDataTable2 = new DataTable();

ChartDataTable2.Columns.Add("Product", typeof(string));
ChartDataTable2.Columns.Add("Percentage", typeof(double));

ChartDataTable2.Rows.Add("Data Cable", 60);
ChartDataTable2.Rows.Add("Charger", 55);
ChartDataTable2.Rows.Add("Smartwatch", 70);
ChartDataTable2.Rows.Add("Earphone", 77);
2.Bind the DataTable object fields to the Charts control.
< Chart:SfChart>
  …
  <chart:ColumnSeries ItemsSource=”{Binding ChartDataTable}” XBindingPath=”Product” YBindingPath=”Percentage”/>
  <chart:ColumnSeries ItemsSource=”{Binding ChartDataTable2}” XBindingPath=”Product” YBindingPath=”Percentage”/>

 </Chart:SfChart>
The resulting chart is shown in the following image.

Note: For more details, refer to how to bind a DataTable in WPF Charts.
Load an array in WPF Charts
An array stores multiple values of the same data type. Configure the WPF Charts XBindingPath or YBindingPath with an indexed array path.
Follow these steps to populate WPF Charts with an array collection:
- Create a business object class with an array collection. In this example, we’ll populate the chart with monthly sales counts for products.
public class Model
{
   private DateTime month;

   public DateTime Month
   {
       get { return month; }
       set { month = value; }
   }

   private double[] saleCount;

   public double[] SaleCount
   {
       get { return saleCount; }
       set { saleCount = value; }
   }


}

public class ViewModel
{
   public ViewModel()
   {
      var date = new DateTime(2015, 1, 1);

      Data = new ObservableCollection<Model>();

      Data.Add(new Model(date.AddMonths(1), new double[] { 698, 948 }));
      Data.Add(new Model(date.AddMonths(2), new double[] { 903, 1203 }));
      Data.Add(new Model(date.AddMonths(3), new double[] { 807, 1107 }));
      Data.Add(new Model(date.AddMonths(4), new double[] { 1058, 1408 }));
      Data.Add(new Model(date.AddMonths(5), new double[] { 954, 1154}));
   }

   public ObservableCollection<Model> Data { get; set; }
}
2.Bind data to the Charts control with an indexed array field.
< Chart:SfChart>
  …
  <chart:ScatterSeries ItemsSource="{Binding Data}" XBindingPath=" Month " YBindingPath=" SaleCount[0]"/>
  <chart:ScatterSeries ItemsSource="{Binding Data}" XBindingPath=" Month " YBindingPath=" SaleCount[1]"/>

< Chart:SfChart>
The output chart is shown in the following image.
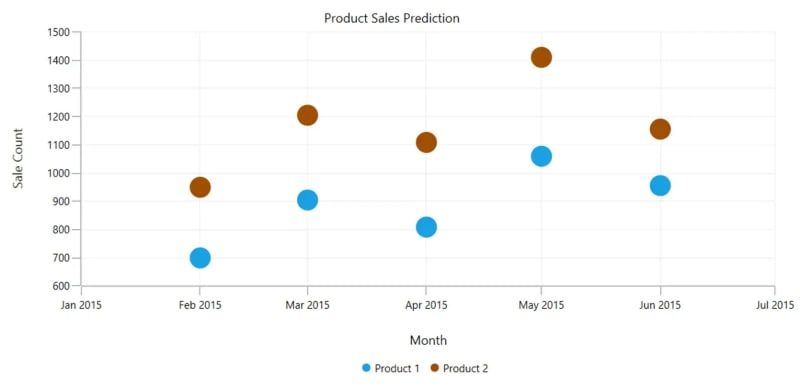
Note: For more details, refer to how to bind array data to WPF Charts.
Load a SQL collection in WPF Charts
Let’s see how to retrieve data from a SQL data set and configure it with the WPF Charts. We’ll set the SQL data set field names to the XBindingPath and YBindingPath properties of the Charts control. To do so, follow these steps:
- Retrieve data from the SQL data set and store it in the local DataTable object. In this example, we’ll handle data concerning yearly computer server performance.
public class ViewModel
{
   public ViewModel()
   {
      try
      {
         SqlConnection thisConnection = new SqlConnection(ConnectionString);
         thisConnection.Open();
         string Get_Data = "SELECT * FROM ChartData";
         SqlCommand cmd = thisConnection.CreateCommand();
         cmd.CommandText = Get_Data;
         SqlDataAdapter sda = new SqlDataAdapter(cmd);
         DataSet ds = new DataSet();
         sda.Fill(ds);
         var table = ds.Tables[0];
         this.DataTable = table;
      }
   }
}
2.Bind the data to the Charts control with the local DataTable fields.
< Chart:SfChart>
  …
  <chart:SplineSeries ItemsSource=”{Binding DataTable}” XBindingPath=”xval” YbindingPath=”yval”/>

< Chart:SfChart>
The resulting chart is shown in the following image.

Note: For more details, refer to how to load SQL data in WPF Charts.
Load JSON data in WPF Charts
JSON (JavaScript Object Notation) is a lightweight data-interchange format file. It allows data to be stored by separating individual data points with commas. Just like with other data formats, we’ll set the locally converted field names as the XBindingPath and YBindingPath.
Let’s see how to retrieve JSON data about monthly oil consumption and plot it in a chart.
- Read data from the JSON file, deserialize it, and then assign it to the local business object ( Model ).
public class ViewModel
{
    public List<Model> Items { get; set; }

    public ViewModel()
    {
       using (var stream = GetType().Assembly.GetManifestResourceStream("JsonDataBinding.Capacities.json"))
       using (TextReader textStream = new StreamReader(stream))
       {
            var text = textStream.ReadToEnd();
            Items = JsonConvert.DeserializeObject<List<Model>>(text);
       }
    }
}
2.Bind the data to the WPF Charts control with the local business object and its fields.
< Chart:SfChart>
  …
  <chart:ColumnSeries XBindingPath="Date" YBindingPath="CapacityUsed" ItemsSource="{Binding Items}"/>

</Chart:SfChart>
The final chart is shown in the following image.
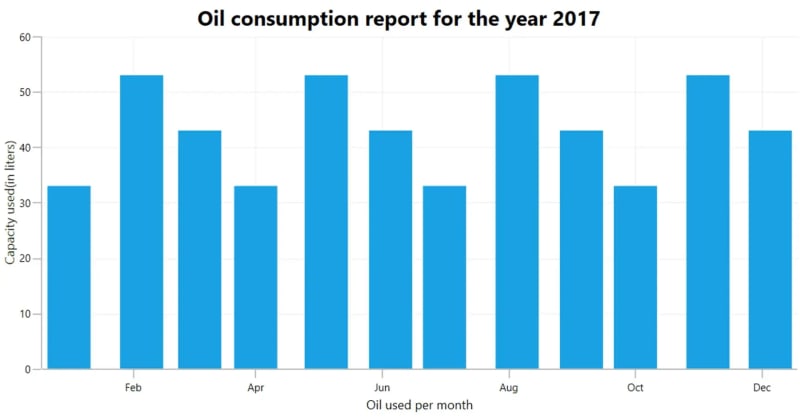
Note: For more details, refer to how to load JSON data in WPF Charts.
Load CSV data in WPF Charts
CSV (comma-separated values) is a prevalent import and export data format used in spreadsheets and databases. Each line in a CSV file is a data record. Each record consists of one or more fields, separated by commas. For the chart, we’ll assign the locally converted field names as the XBindingPath and YBindingPath.
Let’s learn how to retrieve CSV data about monthly appointment details and configure it for a chart.
- Read the data from CSV files and deserialize it. Then assign the data to the local business object ( Model ).
public class ViewModel
{
    public List<Model> Data { get; set; }

    public ViewModel()
    {
       Data = new List<Model>(ReadCSV("..\\..\\ChartData"));
    }

    public IEnumerable<Model> ReadCSV(string fileName)
    {
         List<string> lines = File.ReadAllLines(System.IO.Path.ChangeExtension(fileName, ".csv")).ToList();
         //First row contains the column names
         lines.RemoveAt(0);

         return lines.Select(line =>
         {
             string[] data = line.Split(',');
             return new Model(Convert.ToString(data[0]), Convert.ToDouble(data[1]));
          });
     }
}
2.Bind the data to the WPF Charts control with the local business object and its fields.
<Chart:SfChart>

  <chart:DoughnutSeries XBindingPath="Month" YBindingPath="Appointments" ItemsSource="{Binding Data}"/>

</Chart:SfChart>
The following image shows the resulting chart.
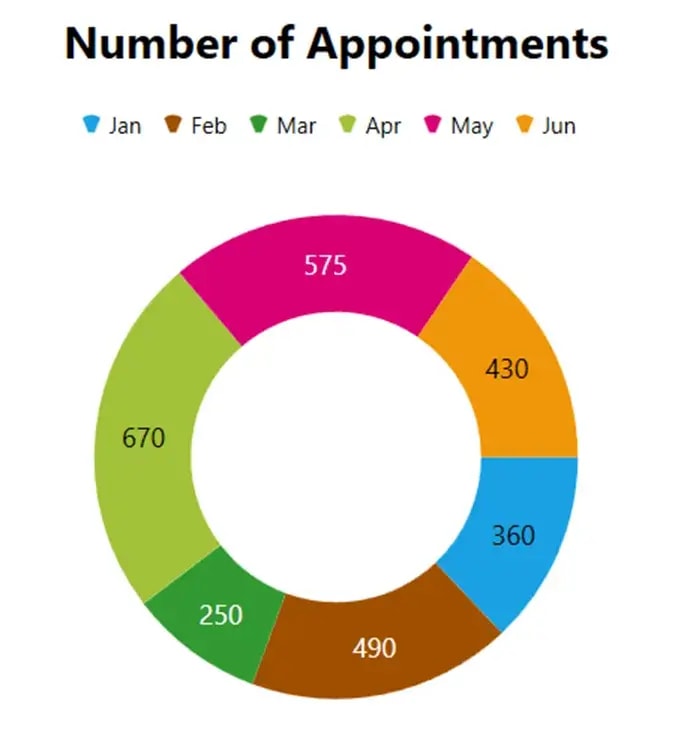
You can also use the complex binding feature to access nested object reference property values to render the charts.
Note: For more details, refer to how to load CSV data in WPF Charts.
GitHub reference
You can check out the complete code examples from this article on GitHub.
Conclusion
Thanks for reading! In this blog, we have seen how to load data from various data sources in WPF Charts. Try them out and leave your feedback in the comments section below!
You can explore our WPF Charts examples to learn more about the supported chart types and how easy it is to configure them for stunning visual effects.
The latest version of the WPF Charts control is available for current customers from the License and Downloads page. If you are not a Syncfusion customer, try our 30-day free trial to check it out.
Also, you can contact us through our support forums, support portal, or feedback portal. We are always happy to assist you!


Latest comments (0)