
Showing routes and highlighting areas are essential features for maps in all web, mobile, and desktop applications. These can be achieved with the help of shapes like lines, arcs, polygons, and circles.
We are excited to inform you that adding these shapes to achieve these functionalities in your Flutter applications is now possible using the new features of our Flutter Maps widget in the 2020 Volume 4 release. In this blog post, I will briefly walk you through the types of shapes that can be added on top of both the shape layer and the tile layer in your Flutter application.
Let’s get started!
Shapes are supported in both shape and tile layers
In the sections that follow, we will cover adding shapes to the tile layer. However, please note that it is also possible to add these shapes to the shape layer too. The steps are exactly the same, except that you will be adding them on the shape layer instead of the tile layer in the code.
Display routes using lines in Flutter Maps
If you need to show road routes or something similar, then the MapLineLayer or MapPolylineLayer will be your best option. The difference between the line and polyline is that the line connects from and to points of the class type MapLatLng, while the latter connects a group of points in the MapLatLng class. Depending on your needs, you can choose either class. The procedure is similar for both. Only the behaviors are different.
The following code example demonstrates the creation of a route in the Flutter Maps widget.
List polylinePoints;

  @override
  void initState() {
    polylinePoints = [
      MapLatLng(13.0827, 80.2707),
      MapLatLng(13.1746, 79.6117),
      MapLatLng(13.6373, 79.5037),
      MapLatLng(14.4673, 78.8242),
      MapLatLng(14.9091, 78.0092),
      MapLatLng(16.2160, 77.3566),
      MapLatLng(17.1557, 76.8697),
      MapLatLng(18.0975, 75.4249),
      MapLatLng(18.5204, 73.8567),
      MapLatLng(19.0760, 72.8777),
    ];
    super.initState();
  }

  @override
  Widget build(BuildContext context) {
    return Scaffold(
      body: SfMaps(
        layers: [
          MapTileLayer(
            initialFocalLatLng: MapLatLng(20.3173, 78.7139),
            initialZoomLevel: 5,
            urlTemplate: 'https://tile.openstreetmap.org/{z}/{x}/{y}.png',
            sublayers: [
              MapPolylineLayer(
                polylines: Set.of([MapPolyline(
                  points: polylinePoints,
                )]),
              ),
            ],
            initialMarkersCount: 2,
            markerBuilder: (context, index) {
              if (index == 0) {
                return MapMarker(
                    iconColor: Colors.white,
                    iconStrokeColor: Colors.blue,
                    iconStrokeWidth: 2,
                    latitude: polylinePoints[index].latitude,
                    longitude: polylinePoints[index].longitude);
              }
              return MapMarker(
                  iconColor: Colors.white,
                  iconStrokeColor: Colors.blue,
                  iconStrokeWidth: 2,
                  latitude: polylinePoints[polylinePoints.length - 1].latitude,
                  longitude: polylinePoints[polylinePoints.length - 1].longitude);
            },
          ),
        ],
      ),
    );
  }
The sample code produces the following screenshot.

Highlight a region using polygons in Flutter Maps
In maps, certain regions are often highlighted using different shapes to indicate some form of data; for example, the border of a region, the population density of a region, and so on. In the Flutter Maps widget, we can use polygon shapes to highlight a region. This is possible using the new MapPolygonLayer which accepts a group of points of type MapLatLng . These points will form a closed polygon.
The following code example uses the MapPolygonLayer to create a region in the map.
List polygon;

  @override
  void initState() {
    polygon = [
      MapLatLng(38.8026, -116.4194),
      MapLatLng(46.8797, -110.3626),
      MapLatLng(41.8780, -93.0977),
    ];
    super.initState();
  }

  @override
  Widget build(BuildContext context) {
    return SfMaps(
        layers: [
          MapTileLayer(
            urlTemplate: 'https://tile.openstreetmap.org/{z}/{x}/{y}.png',
            sublayers: [
              MapPolygonLayer(
                  polygons: Set.of([MapPolygon(
                      points: polygon,
                      color: Colors.blue[200],
                      strokeColor: Colors.blue[900],
                      strokeWidth: 3
                  )
                  ])
              ),
            ],
            initialZoomLevel: 4,
            initialFocalLatLng: MapLatLng(39.0119, -98.4842),
          ),
        ]
    );
  }
}
The following screenshot shows the results of this code.

Show air routes using arcs in Flutter Maps
Arcs are similar to lines in that they connect from and to points, but arcs draw a curve instead of a straight line. They are most often used to show air routes between different locations. Drawing arcs in the Flutter Maps widget is now possible using our newly introduced MapArcLayer.
You can customize the height and center point of the arcs using the direct APIs.
The following code example shows how to draw arcs.
@override
  void initState() {
    data = [
      DataModel(MapLatLng(28.7041, 77.1025), MapLatLng(56.1304, -106.3468)),
      DataModel(MapLatLng(28.7041, 77.1025), MapLatLng(-9.1900, -75.0152)),
      DataModel(MapLatLng(28.7041, 77.1025), MapLatLng(61.5240, 105.3188)),
      DataModel(MapLatLng(28.7041, 77.1025), MapLatLng(-25.2744, 133.7751)),
    ];
    super.initState();
  }

  @override
  Widget build(BuildContext context) {
    return Scaffold(
      body: Padding(
        padding: EdgeInsets.all(10),
        child: SfMaps(layers: [
          MapTileLayer(
            urlTemplate: 'https://tile.openstreetmap.org/{z}/{x}/{y}.png',
            sublayers: [
              MapArcLayer(
                arcs: List.generate(data.length, (int index) {
                  return MapArc(
                    from: data[index].from,
                    to: data[index].to,
                  );
                }).toSet(),
              ),
            ],
            initialMarkersCount: 5,
            markerBuilder: (context, index) {
              if (index == 0) {
                return MapMarker(
                    iconColor: Colors.white,
                    iconStrokeColor: Colors.blue,
                    iconStrokeWidth: 2,
                    latitude: data[index].from.latitude,
                    longitude: data[index].from.longitude);
              }
              return MapMarker(
                  iconColor: Colors.white,
                  iconStrokeColor: Colors.blue,
                  iconStrokeWidth: 2,
                  latitude: data[index - 1].to.latitude,
                  longitude: data[index - 1].to.longitude);
            },
          ),
        ]),
      ),
    );
  }
}

class DataModel {
  DataModel(this.from, this.to);

  final MapLatLng from;
  final MapLatLng to;
}
Refer to the following screenshot.

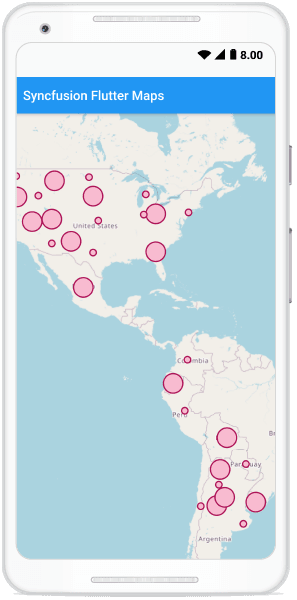
Add circles on Flutter Maps
You can add circles in the Flutter Maps widget to visualize any numerical form of data. Circles can be drawn by populating the MapCircleLayer with MapCircle class instances. You can position a circle by specifying the MapLatLng, which is the center point of the circle. The radius of the circle is used to show the magnitude of data in a relative manner compared to other circles on the map.
Refer to the following code example.
List circles;

  @override
  void initState() {
    circles = [
      // North America coordinates
      MapLatLng(34.0489, -111.0937),
      MapLatLng(34.5199, -105.8701),
      MapLatLng(31.9686, -99.9018),
      MapLatLng(39.3210, -111.0937),
      MapLatLng(39.0119, -98.4842),
      MapLatLng(38.8026, -116.4194),
      MapLatLng(44.0682, -114.7420),
      MapLatLng(43.9695, -99.9018),
      MapLatLng(47.5515, -101.0020),
      MapLatLng(40.4173, -82.9071),
      MapLatLng(40.2672, -86.1349),
      MapLatLng(46.8797, -110.3626),
      MapLatLng(44.3148, -85.6024),
      MapLatLng(43.8041, -120.5542),
      MapLatLng(47.7511, -120.7401),
      MapLatLng(32.1656, -82.9001),
      MapLatLng(40.7128, -74.0060),
      MapLatLng(23.6345, -102.5528),

      // South America coordinates
      MapLatLng(4.5709, -74.2973),
      MapLatLng(-1.8312, -78.1834),
      MapLatLng(-9.1900, -75.0152),
      MapLatLng(-16.2902, -63.5887),
      MapLatLng(-23.4425, -58.4438),
      MapLatLng(-32.5228, -55.7658),
      MapLatLng(-37.3288, -59.1367),
      MapLatLng(-33.3017, -66.3378),
      MapLatLng(-33.4489, -70.6693),
      MapLatLng(-31.4201, -64.1888),
      MapLatLng(-28.4696, -65.7795),
      MapLatLng(-24.7821, -65.4232)
    ];

    super.initState();
  }

  @override
  Widget build(BuildContext context) {
    return SfMaps(
        layers: [
          MapTileLayer(
            urlTemplate: 'https://tile.openstreetmap.org/{z}/{x}/{y}.png',
            sublayers: [
              MapCircleLayer(
                circles: List.generate(
                  circles.length,
                      (int index) {
                    return MapCircle(
                      color: Colors.pink[100],
                      center: circles[index],
                      radius: index % 2 == 0 ? 5 : 15,
                      strokeWidth: 2,
                      strokeColor: Colors.pink[800],
                    );
                  },
                ).toSet(),
              ),
            ],
            initialFocalLatLng: MapLatLng(10.6345, -85.5528),
            initialZoomLevel: 3,
          )
        ]
    );
  }
}
The following screenshot shows the use of circles in a map.
Shape features
In the previous topics, we have seen the basic uses of these shapes and how to include them in a Flutter application. Let’s go a little deeper and see some additional exciting features available in these shapes that you should know.
Tooltip
Tooltips are essential for showing additional information about any kind of UI. As you would expect, tooltip support is available for all these shapes, and even custom widgets can be shown as tooltips.
Refer to the following screenshot.

For more details about the tooltip feature, refer to this documentation link.
Animation
Animation effects are used to make the UI more attractive. You can add animations to all the line, polyline, circle, and arc shapes. The best part is that the animation APIs allow you to completely customize the animation without any restrictions. You can control the duration of the animation, animate it in forward or reverse, and repeat the animation as needed.
The following GIF image shows animation in action.

To learn more about animation support, refer to this documentation link.
Selection
If you want to perform any specific functionality while tapping on shapes, like changing the color of the tapped shape or navigating to a different page, use the onTap callback of each shape.
For more details about the selection feature, refer to this documentation link.
Customization
All shapes are completely customizable. You can customize them to display dashed lines, change their color and stroke width, and much more.
Refer to the following screenshot.

For more details about customization, please refer to this link.
Conclusion
In this blog post, we walked you through how to add and use the newly introduced line, polyline, arc, and circle shapes in the Flutter Maps widget. These features are available in our 2020 Volume 4 release. Try them out and share your feedback in the comments section below.
You can check out the other new widgets and features added to this release on our What’s New page and in the release notes. Check out the complete user guide and browse our samples at this GitHub location. Additionally, you can check out our demo apps in Google Play, the App Store, and on our website.
If you need a new widget for the Flutter framework or new features in our existing widgets, you can contact us through our support forums, Direct-Trac, or feedback portal. As always, we are happy to assist you!
If you like this blog post, we think you will also like the following articles too:


Top comments (0)