
In this blog post, we will walk through the conditional formatting feature in the Syncfusion JavaScript Spreadsheet. It helps you highlight a cell or a range of cells with a certain color based on applied conditions, and showcases the data by using data bars, color scales, and icon sets that correspond to specific variations in the data. The different types of conditional formatting options available in the JavaScript Spreadsheet are:
Highlight cell rules
The highlight cell rules option enables you to highlight cells with colors depending on the rules applied. The following conditions can be used for highlight cell rules:
- GreaterThan
- LessThan
- Between
- EqualTo
- ContainsText
- DateOccur
- Duplicate
- Unique
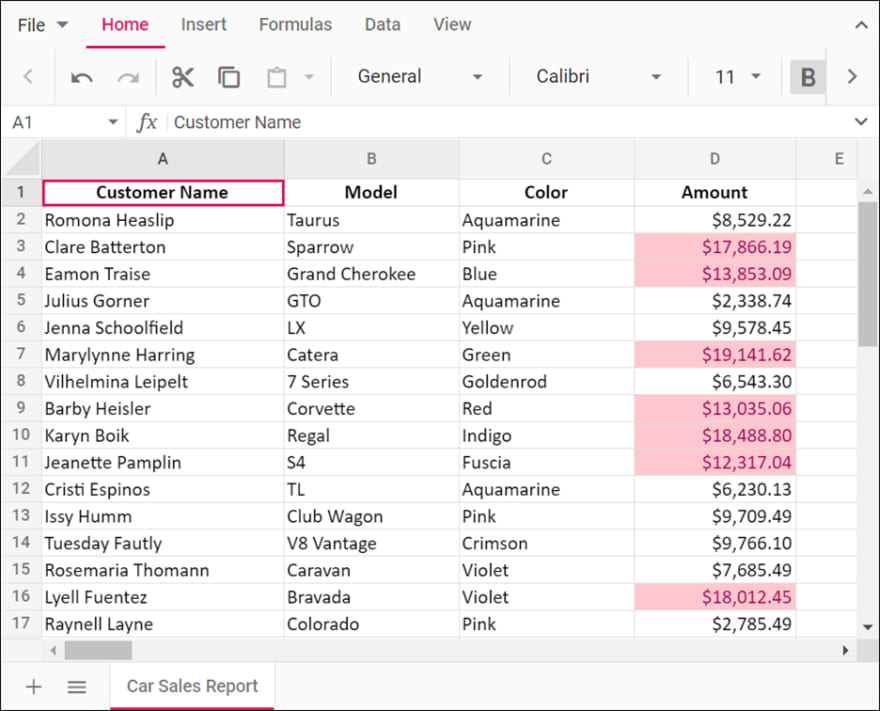
In the following screenshot, formatting is applied to values greater than 10,000 in the Amount column in JavaScript Spreadsheet.
Top and bottom rules
The top and bottom rules allow you to apply formatting to the cells in JavaScript Spreadsheet whose values meet a given threshold.
The following conditions can be used for the top and bottom rules:
- Top10Items
- Bottom10Items
- Top10Percentage
- Bottom10Percentage
- BelowAverage
- AboveAverage
The following preset colors can be used for formatting styles:
- RedFT: light red fill with dark red text.
- YellowFT: yellow fill with dark yellow text.
- GreenFT: green fill with dark green text.
- RedF: red fill.
- RedT: red text.
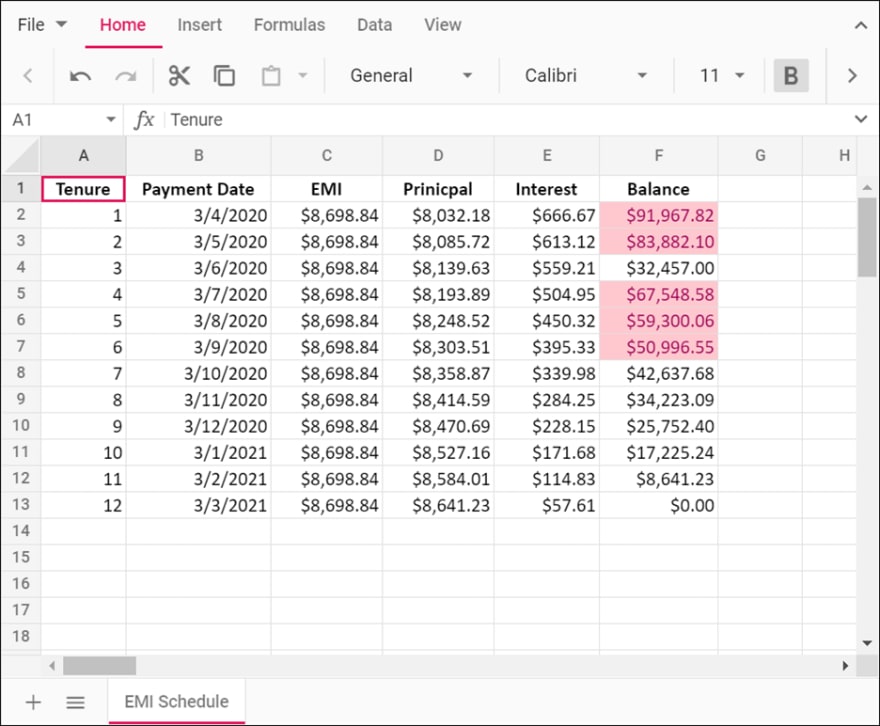
In the following screenshot, the Top 10 Items rule is applied with the RedFT style to the Balance column in JavaScript Spreadsheet.
Data bars
Data bars make it easy to visualize the value in a cell or a range of cells. It shows the data of a cell as a bar. When used for a range of cells, the longest bar represents the highest value of the range, and shorter bars represent smaller values.
The following styles can be used for data bars:
- BlueDataBar
- GreenDataBar
- RedDataBar
- OrangeDataBar
- LightBlueDataBar
- PurpleDataBar
In the following screenshot, data bars are applied to the Purchase Price and Selling Price columns in JavaScript Spreadsheet.

Color scales
Color scales visualize cell data as colors, where the color changes based on the cell value. A color scale has a minimum of two colors (e.g., GY uses green and yellow) and a maximum of three colors (e.g., GYR uses green, yellow, and red). The first color represents the lower value, the last color represents the higher value, and the middle color represents median value.
The following options can be used for color scale types:
- GYRColorScale
- RYGColorScale
- GWRColorScale
- RWGColorScale
- BWRColorScale
- RWBColorScale
- WRColorScale
- RWColorScale
- GWColorScale
- WGColorScale
- GYColorScale
- YGColorScale
In the following screenshot, a color scale is applied to the Quantity column in JavaScript Spreadsheet.

Icon sets
Icon sets in the JavaScript Spreadsheet control make it easy to visualize the data of a cell or range of cells. Each icon represents a range of values. The control supports three sets of icons:
- Three icons (e.g., three arrows).
- Four icons (e.g., four arrows).
- Five icons (e.g., five arrows).
These icons will be applied based on the percentage of values in the cell or range of cells.
The following options are available for the icon type:
- ThreeArrows
- ThreeArrowsGray
- FourArrowsGray
- FourArrows
- FiveArrowsGray
- FiveArrows
- ThreeTrafficLights1
- ThreeTrafficLights2
- ThreeSigns
- FourTrafficLights
- FourRedToBlack
- ThreeSymbols
- ThreeSymbols2
- ThreeFlags
- FourRating
- FiveQuarters
- FiveRating
- ThreeTriangles
- ThreeStars
- FiveBoxes
In the following screenshot, an icon set is applied to the Rating column in JavaScript Spreadsheet.
![]()
Custom conditional formatting in JavaScript Spreadsheet
Using the custom conditional formatting support in JavaScript Spreadsheet, you can customize cell styles like color, background color, font styles, and properties based on the conditions applied.
Where are the conditional formatting options?
On the Home tab of the ribbon, you can find the Conditional Formatting drop-down button.

Adding conditional formatting in JavaScript Spreadsheet through code
In the JavaScript Spreadsheet control, you can add conditional formatting through code by using the conditionalFormat public method and passing the format options with it.
The following code example showcases the application conditional formatting.
/**
 * Conditional Formatting
 */

    loadCultureFiles();

    //Initialize Spreadsheet component.
    let spreadsheet: Spreadsheet = new Spreadsheet({
        sheets: [{
            rows: [{
                height: 30,
                cells: [{
                    index: 1,
                    value: 'Inventory List',
                }]
            }],
            ranges: [{
        //Referred
                dataSource: (dataSource as any).conditionalFormatting,
                startCell: 'A2'
                },
            ],
            name: 'Inventory List',
            conditionalFormats: [
                { type: 'GYRColorScale', range: 'C3:C18' },
                { type: 'LessThan', cFColor: 'RedFT', value: '8/30/2019', range: 'G3:G18' }
            ] } ],
        created: () => {
            spreadsheet.merge('A1:H1');
            spreadsheet.cellFormat({ fontWeight: 'bold', textAlign: 'center' }, 'A2:H2');
            spreadsheet.cellFormat({ fontWeight: 'bold', textAlign: 'center', verticalAlign: 'middle', fontSize: '13pt' }, 'A1:H1');
            spreadsheet.numberFormat('$#,##0.00', 'F3:F18');
            spreadsheet.conditionalFormat({ type: 'BlueDataBar', range: 'D3:D18' });
            spreadsheet.conditionalFormat({ type: 'GreenDataBar', range: 'E3:E18' });
            spreadsheet.conditionalFormat({ type: 'ThreeStars', range: 'H3:H18' });
            spreadsheet.conditionalFormat({ type: 'Top10Items', value: '1',
             format: { style: { color: '#ffffff', backgroundColor: '#009999', fontWeight: 'bold'}}, range: 'F3:F18' });
            spreadsheet.conditionalFormat({ type: 'Bottom10Items', value: '1',
             format: { style: { color: '#ffffff', backgroundColor: '#c68d53', fontWeight: 'bold'}}, range: 'F3:F18' });
        }
    });
    //Render initialized Spreadsheet component.
    spreadsheet.appendTo('#spreadsheet');
The following screenshot shows the conditional formatting applied to the JavaScript Spreadsheet component through the previous code sample.

Resource
For more information, you can check out JavaScript Spreadsheet: Conditional Formatting demo.
Conclusion
I hope you now have a better understanding of the conditional formatting feature in the Syncfusion JavaScript Spreadsheet control. Please share your thoughts about it in the comments section below.
If you’re already a Syncfusion user, you can download the Essential Studio for JavaScript product setup to try out this control. Otherwise, you can download a free 30-day trial.
If you have any questions about these features, please contact us through our support forums, Direct-Trac, or feedback portal. We are happy to assist you!
If you like this blog post, we think you’ll like the following articles too:
- Formatting the Essential JavaScript Spreadsheet: Number Formatting [Blog]
- Formatting the Essential JavaScript Spreadsheet: Cell Formatting [Blog]
- Bulk Edit Columns in JavaScript DataGrid [Blog]
- Bind Remote Data and Enable Virtual Scrolling in JavaScript Pivot Table [Blog]
- JavaScript Succinctly [eBook]


Top comments (0)