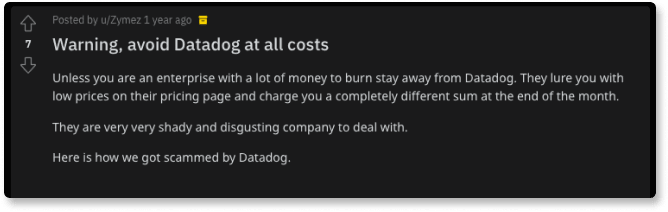
Are you looking for a DataDog alternative? Then you have come to the right place. In this article, we will go through top 5 DataDog alternatives. One of the biggest challenge users face with DataDog is its pricing policies.
For bigger enterprises it might make sense to shell out huge monitoring bills, but it's often out of question for small and medium size enterprises.
The space is highly competitive, but there are a few products that stand out. In this article we will go through the best DatDog alternatives which you can explore while selecting your vendor for application monitoring.
List of top DataDog alternatives in 2021:
SigNoz
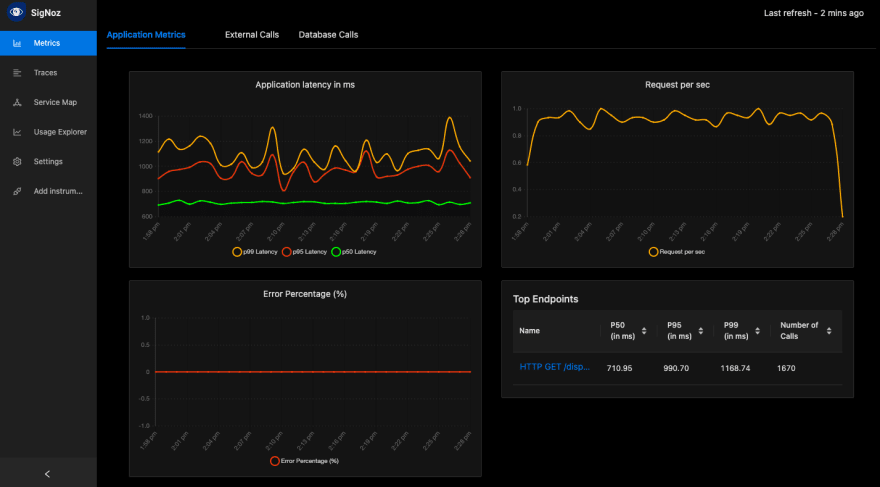
SigNoz is full-stack open-source application monitoring and observability tool which can be a great DataDog alternative. It can be hosted within your infra, and as such, you don't need to send your data to a third-party vendor. It uses distributed tracing to help developers gauge the performance of their application in production. It captures both metrics and traces with log management currently in the product roadmap.
A few things that SigNoz can help you with as a DataDog alternative are:
- Track the popular RED metrics
- Rate of user requests
- Error rate in user requests
- Duration taken to complete user requests
- p99, p95 & p50 latencies for your application
- External API calls, Database calls, and top endpoints
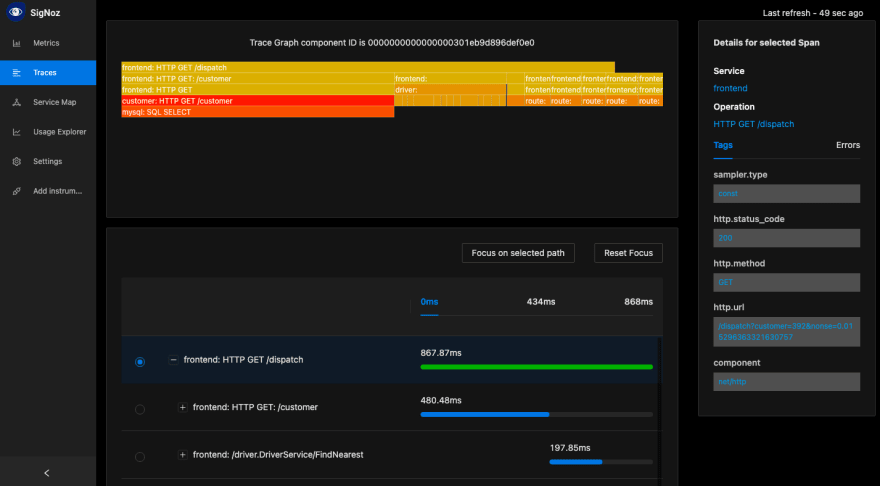
- Track transactions across different microservices using distributed tracing
SigNoz uses OpenTelemetry - a vendor-agnostic instrumentation library for generating telemetry data. OpenTelemetry is a project under Cloud Native Computing Foundation and is becoming the industry standard for creating portable telemetry data.
New Relic
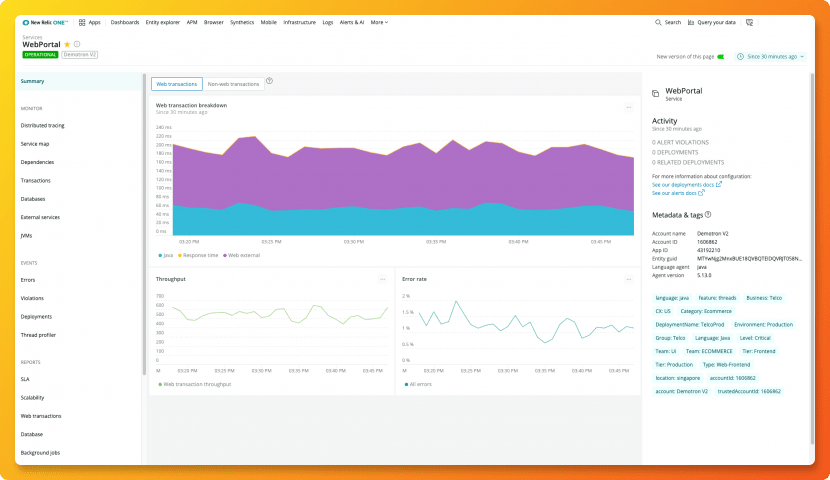
New Relic is one of the oldest companies in this domain and can be a solid DataDog alternative. If you opt for a full user plan, you can get access to all the tools New Relic provides in its observability stack. The list of tools are:
- Application Monitoring
- Browser Monitoring
- Mobile Monitoring
- Synthetic Monitoring
- Serverless Monitoring
- Infrastructure Monitoring
- Log Management
Standard offering includes plans for teams upto 5 full users. Their pricing depends on the amount of data ingested with 100 GB free data ingest and $0.25 per extra GB. You can visit their pricing page for details.
Dynatrace
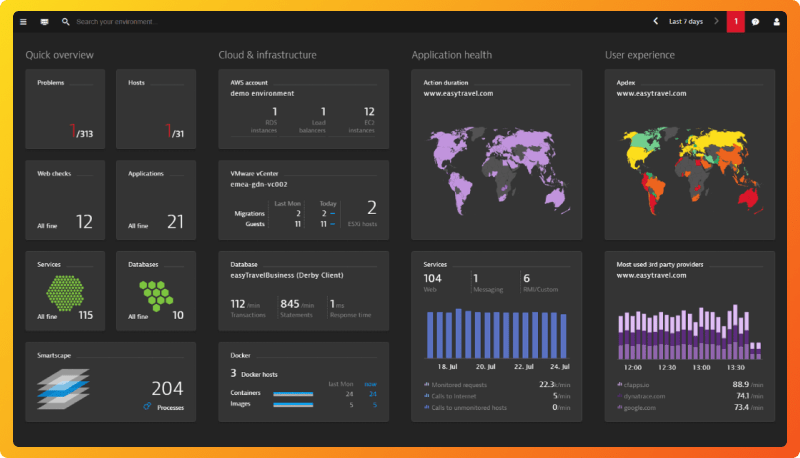
Dynatrace is a DataDog alternative that provides a broad spectrum of monitoring services aimed at large-scale enterprises. To use Dynatrace, you need to install a single agent per host which will collect all relevant metrics. Dynatrace calls this agent, OneAgent and it can serve the following use-cases for monitoring:
- Analyze performance of all user requests within your application
- Monitor server side services
- Network monitoring
- Cloud and virtual machines monitoring
- Monitor containerized environments like Docker, Kubernetes
- Root-cause analysis
Full-stack monitoring, the Dynatrace product aimed to provide observability for apps, is priced at $69 per month for 8 GB per host if billed annually.
Prometheus
Prometheus can serve as a DataDog alternative if you are looking to track only metrics for your applications. It was initially developed at SoundCloud in 2012 before being released as an open-source project. It was the second project to graduate from CNCF after Kubernetes. If you want to opt for an open-source tool for metrics monitoring, then Prometheus can be a good option.
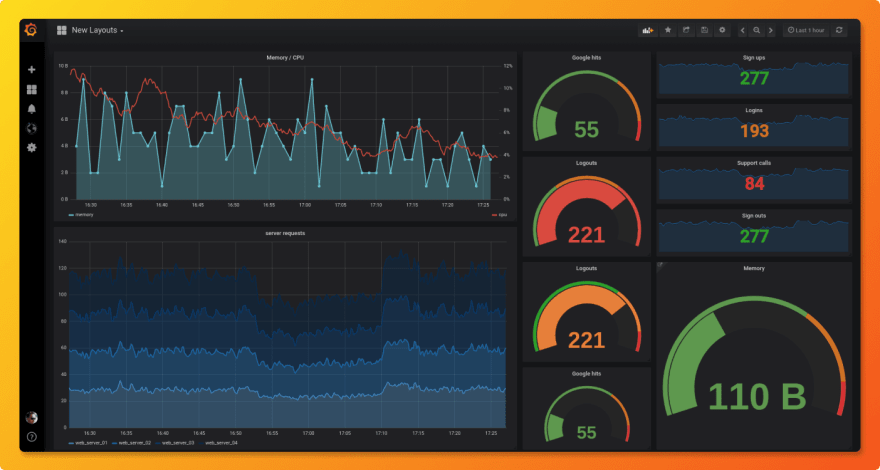
It enables you to capture time-series data as metrics. It's a pull-based monitoring system where the Prometheus server pulls metrics from exporters known as Prometheus targets. Other components in the Prometheus architecture include:
- A query language known as PromQL is used to query collected time-series data
- In-built alert manager which is used for managing notifications and silencing
- Visualization layer, which includes a built-in expression browser
The visualization layer of Prometheus is basic, and it is often used alongside Grafana, an open-source analytics, and visualization tool.

Logicmonitor
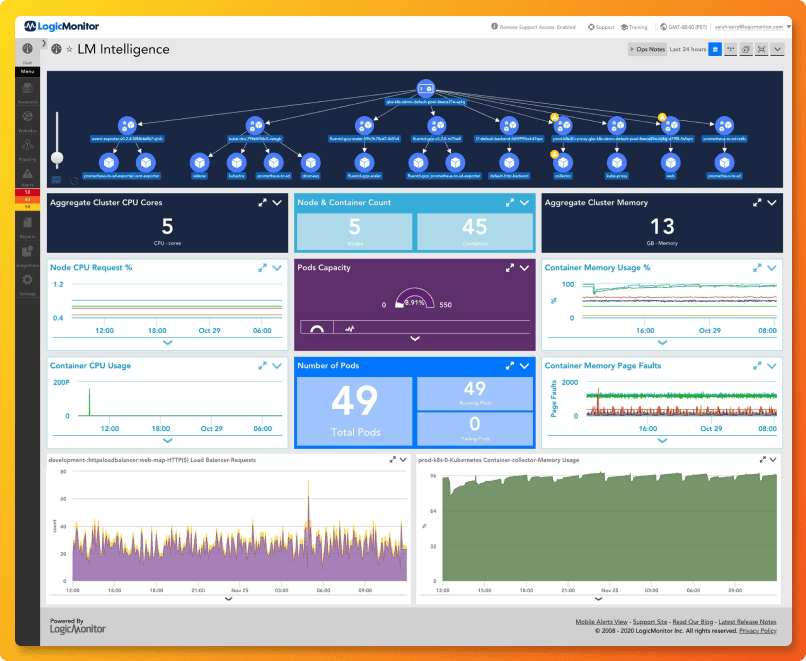
LogicMonitor is a cloud-based infrastructure monitoring platform that can be used as a DataDog alternative if you're looking for infrastructure monitoring. It also provides AIOps features, including root cause analysis, anomaly detection, and forecasting.
With dynamic topology mapping, you can have an overview of your network devices and their inter-dependency. Some of the key monitoring capabilities provided by LogicMonitor are:
- Cloud Monitoring (AWS, Google and Azure)
- Container Monitoring (Kubernetes)
- Network Monitoring
- Server Monitoring
- Storage Monitoring
- Database Monitoring
Conclusion
Monitoring and observability are critical components that you can't ignore for your applications in the production environment. As such, choosing the right tool which can empower you to take actions proactively is very important. Though DataDog is a good tool, it has its own challenges, including cost, unclear pricing policies, and complex UI.
The above DataDog alternatives can be a good option to meet your monitoring needs. A tool like SigNoz can provide you with out of box features like a SaaS vendors while still being open-source.
If you want to check out SigNoz GitHub repo👇
Read more about SigNoz:
Monitor your Spring Boot application with OpenTelemetry and SigNoz
How to set up Golang application performance monitoring with SigNoz


Top comments (1)
I can add one!
Insight Cat - full-stack infrastructure monitoring platform for software and hardware. The solution was created to combine the best of multi-tool solutions like Zabbix, New Relic, Datadog, etc.
insightcat.com/
It aims to provide:
Check it out!