If you want to check our Github repo before diving in 👇
Node.js tops the list of most widely used frameworks by developers. Powered by Google's V8 javascript engine, its performance is incredible. Ryan Dahl, the creator of Node.js, wanted to create real-time websites with push capability. On Nov 8, 2009, Node.js was first demonstrated by Dahl at the inaugural European JSconf. Node.js has now become a critical component in the technology stack of large-scale enterprises. But like any technology, it has its own set of limitations.
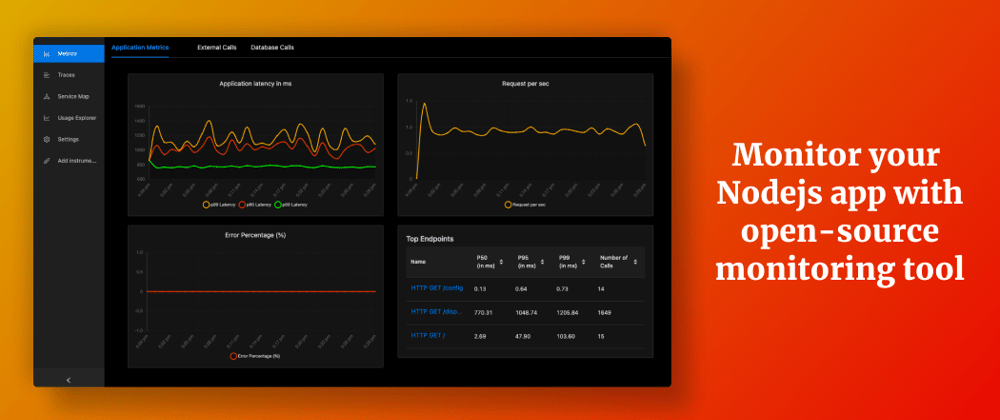
Node.js is a dynamically typed single-threaded programming language. There is a lot of freedom for the interpreter and runtime to make decisions that can easily lead to memory leaks and high CPU loads. This can lead to performance issues, loss of resources, and potential downtime. Hence, it is crucial to monitor your Node.js apps for app performance metrics.
SigNoz is an open-source application monitoring and observability platform which can be installed within your infra. There's no need to go through any sales team or complex onboarding process to start monitoring your application with SigNoz. In this article, let's take a look at how it can be deployed with Docker in a sample Node.js application.
Let's divide this tutorial into 2 parts:
- Installing SigNoz
- Installing & setting up a sample Node.js app for monitoring
Part-1 Installing SigNoz
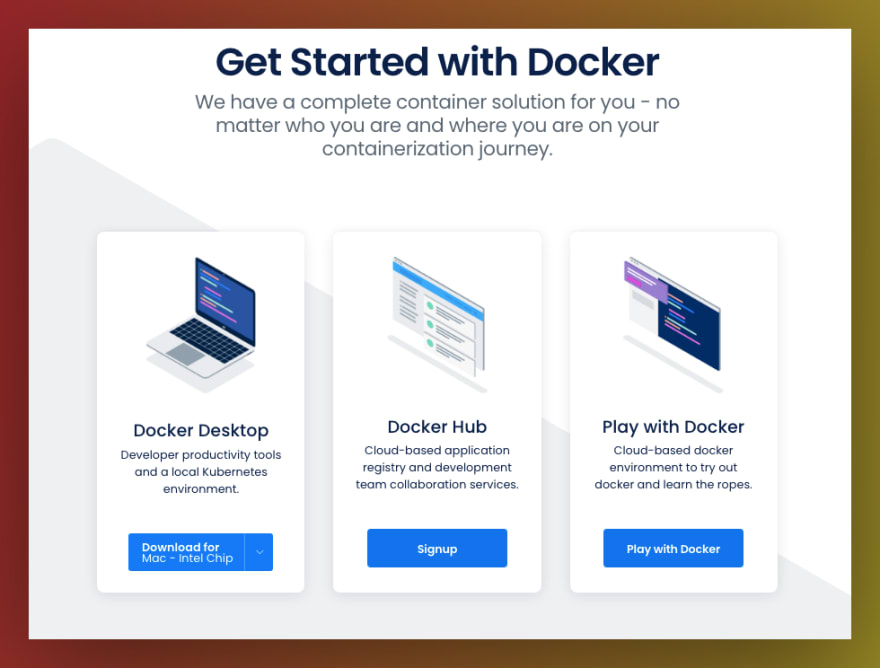
Install Docker
You can install Docker by following the steps listed on their website here. For this tutorial, you can choose the Docker Desktop option based on the system you have.
Clone SigNoz GitHub repository
From your terminal use the following command to clone SigNoz's GitHub repository.
git clone https://github.com/SigNoz/signoz.git
Update path to signoz/deploy and install SigNoz
The deploy folder contains the files necessary for deploying SigNoz through Docker.
cd signoz/deploy/
./install.sh
You will be asked to select one of the 2 ways to proceed:
- Clickhouse as database (default)
- Kafka + Druid setup to handle scale (recommended for production use)
Trying out SigNoz with clickhouse database takes less than 1GB of memory and for this tutorial, we will use that option.
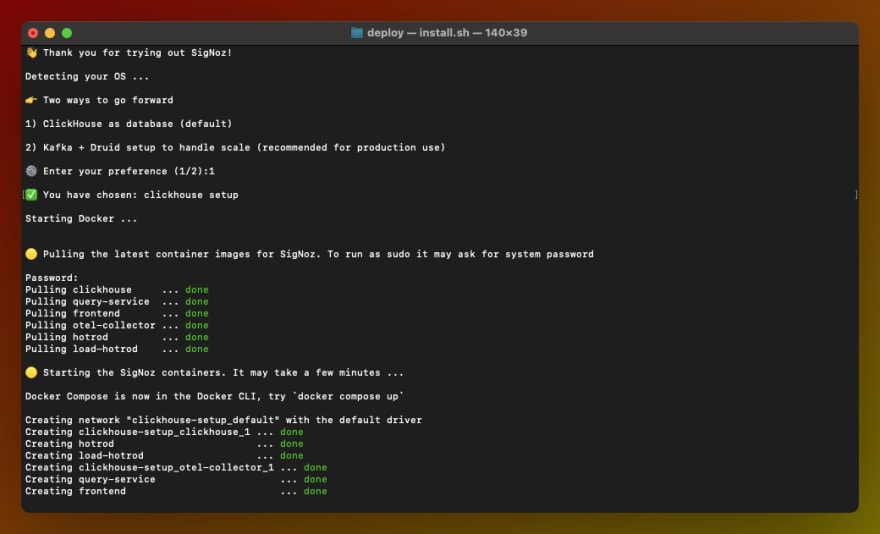
You will get the following message once the installation is complete.
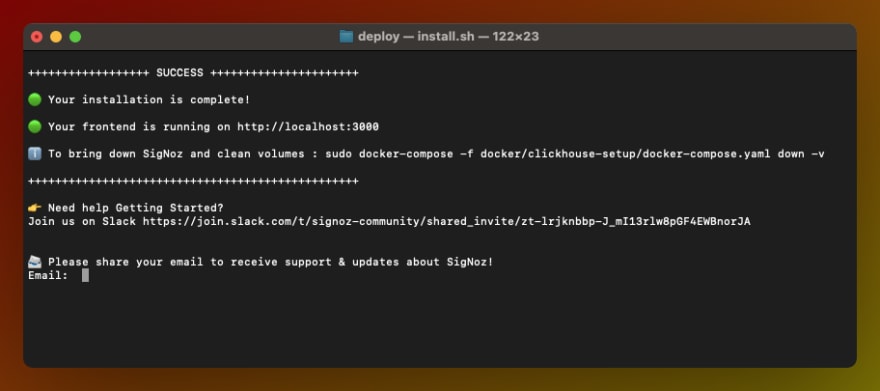
Once the installation runs successfully, the UI should be accessible at port 3000. Wait for 2-3 mins for the data to be available to frontend.
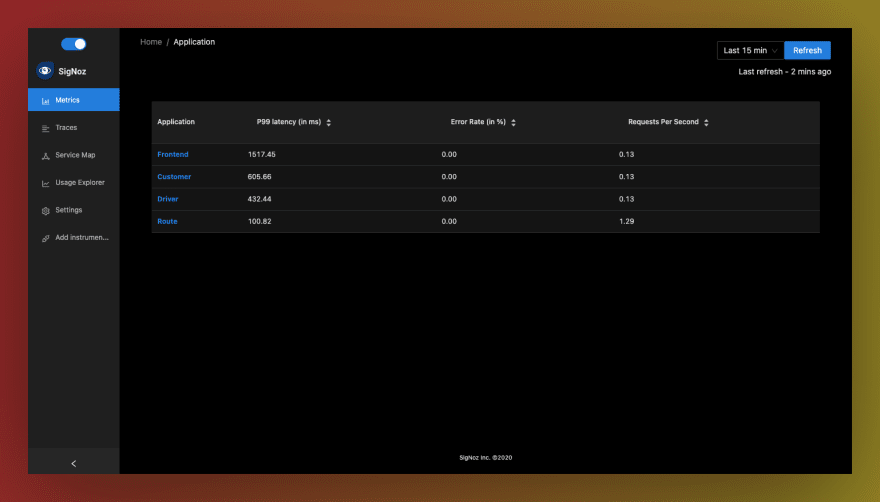
The applications shown in the dashboard are from a sample app called Hot R.O.D that comes with the installation bundle. It has 4 microservices being monitored: Frontend, Customer, Driver and Route. You can access the Hot R.O.D application UI at: http://localhost:9000/
Now comes the part where you can instrument your own sample app and get the metrics reported through SigNoz.
Part 2 - Installing & setting up a sample Node.js app for monitoring
To start monitoring your application, you need to set up its instrumentation. Instrumentation is the process of implementing code instructions to monitor your application's performance.
SigNoz supports OpenTelemetry as the primary way for users to instrument their application. OpenTelemetry is a single, vendor-agnostic instrumentation library per language with support for both automatic and manual instrumentation. You don't need to worry about instrumentation in this tutorial. OpenTelemetry comes with all currently available instrumentation.
But to see how SigNoz helps you in monitoring an app's performance, we need an app first.
You need to ensure that you have Node.js version 12 or newer. You can download the latest version of Node.js here. For the sample application, let's create a basic 'hello world' express.js application.
Make a directory and install express
Make a directory for your sample app on your machine. Then open up the terminal, navigate to the directory path and install express with the following command:
npm i express
Setup server.js
Create a file called 'server.js' in your directory and with any text editor setup your 'Hello World' file with the code below:
const express = require('express');

const app = express();

app.get('/hello', (req, res) => {
 res.status(200).send('Hello World');
});

app.listen(9090);
Boot up the server with the following command on the terminal:
node server.js
You can check if your app is working by visiting: http://localhost:9090/hello
Once you are finished checking, exit the localhost on your terminal.
Setting up OpenTelemetry
In the same directory path at the terminal, install the OpenTelemetry launcher package with this command:
npm install lightstep-opentelemetry-launcher-node
Go to your directory and create a new file named, "server_init.js". This will act as the new entry point for your app. Paste the following code in the file:
const {
    lightstep,
    opentelemetry,
   } = require('lightstep-opentelemetry-launcher-node');

   const sdk = lightstep.configureOpenTelemetry();

   sdk.start().then(() => {
    require('./server');
   });

   function shutdown() {
    sdk.shutdown().then(
      () => console.log("SDK shut down successfully"),
      (err) => console.log("Error shutting down SDK", err),
    ).finally(() => process.exit(0))
   };

   process.on('exit', shutdown);
   process.on('SIGINT', shutdown);
   process.on('SIGTERM', shutdown);
Once the file is created, you only need to run one last command at your terminal.
OTEL_EXPORTER_OTLP_SPAN_ENDPOINT="http://<IP of SigNoz Backend>:55681/v1/trace" LS_SERVICE_NAME=<service name> node server_init.js
Replacing the placeholders in the above command for local host:
IP of SigNoz Backend: localhost (since we are running SigNoz on our local host)
service name: sample_app (you can give whatever name that suits you)
So the final command is:
OTEL_EXPORTER_OTLP_SPAN_ENDPOINT="http://localhost:55681/v1/trace" LS_SERVICE_NAME=sample_app node server_init.js
The app should be accessible at http://localhost:9090/hello.
Congratulations! You have instrumented your sample Node.js app. You can now access the SigNoz dashboard at http://localhost:3000 to monitor your app for performance metrics.

If you don't find 'Sample_app' in your list of applications, hit the endpoint at port 9090, and wait for 1-2 mins.
Identifying events causing high latency in your app
Now that you have installed SigNoz, let's see how you can identify specific events causing high latency in your deployed applications.
In just 5 easy steps, SigNoz dashboard lets you drill down to events causing a delay in your deployed apps 👇
- Choose your microservice
- Choose the timestamp where latency is high
- Click on view traces
- Choose the trace ID with the highest latency
- Zero in on the highest latency event and take action
Here's a glimpse of how you can drill down and identify specific issues:
If you need any help with trying out SigNoz, feel free to mail me at ankit.anand@signoz.io.
They say, "If it's not monitored, then it's not in production." And with SigNoz you can start monitoring your Node.js application now. Enabling your team to resolve issues quickly in production is critical to maintaining complex distributed systems in fine health.
At SigNoz, we are committed to making the best open-source, self-hosted tool for application performance monitoring. Feel free to check out our GitHub repo here:
 SigNoz
/
signoz
SigNoz
/
signoz
SigNoz is an open-source APM. It helps developers monitor their applications & troubleshoot problems, an open-source alternative to DataDog, NewRelic, etc. 🔥 🖥. 👉 Open source Application Performance Monitoring (APM) & Observability tool

Monitor your applications and troubleshoot problems in your deployed applications, an open-source alternative to DataDog, New Relic, etc.


Documentation • ReadMe in Chinese • ReadMe in German • ReadMe in Portuguese • Slack Community • Twitter
SigNoz helps developers monitor applications and troubleshoot problems in their deployed applications. SigNoz uses distributed tracing to gain visibility into your software stack.


Join our Slack community
Come say Hi to us on Slack

Features:
- Application overview metrics like RPS, 50th/90th/99th Percentile latencies, and Error Rate
- Slowest endpoints in your application
- See exact…


Top comments (0)