Setting up observability and robust monitoring for distributed systems is a challenging task. Engineering teams need access to different pieces of information to understand what's happening with their application. Is OpenTelemetry a step in the right direction for distributed tracing? Let's find out.
Nothing can guarantee how your systems will behave in production. Things will go wrong, and it's critical to monitor your application for any signs that need troubleshooting. A robust monitoring and observability framework requires telemetry data - logs, metrics and traces.
OpenTelemetry aims to standardize the creation and management of telemetry data. It can fit within any application's architecture and generate telemetry data with little to no overhead.

Why is distributed tracing needed?
In microservices architecture, often engineering teams are responsible for just one service and it becomes a nightmare to troubleshoot issues without an overview. Correlating logs and metrics is challenging with a lot of manual effort.
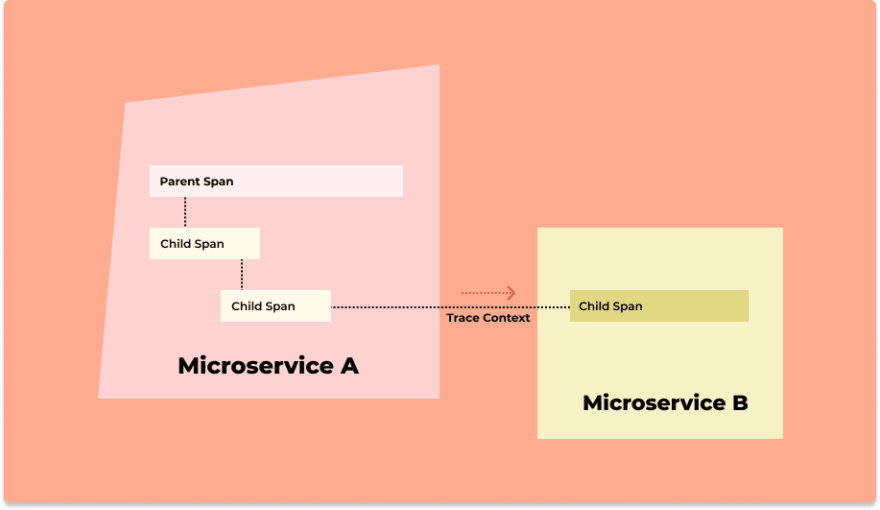
That's where distributed tracing comes into the picture. User requests are broken down into spans.
What are spans?
Spans represent a single operation within a trace.
It represents work done by a single service which can be broken down further depending on the use case.
A trace context is passed along when requests travel between services, which tracks a user request across services. You can see how a user request performs across services and identify what exactly needs your attention without manually shifting through multiple dashboards.
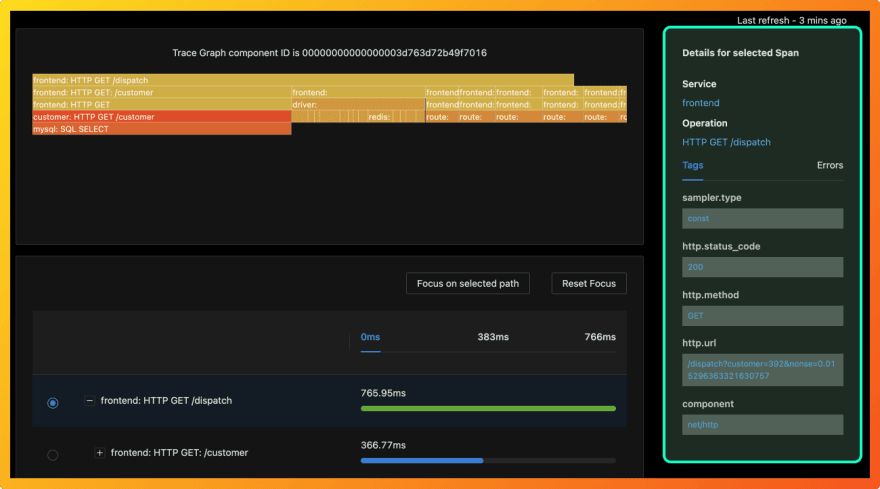
Using OpenTelemetry you can encapsulate several pieces of information with a span. Common information includes the name of the operation, start and end timestamp, events occurring during the span. You can also add custom attributes with key/value pairs to enable more insights if needed.
In the picture below, you can see the details for the selected span. SigNoz is a lightweight open-source APM tool based on OpenTelemetry, which can be used as an analysis tool.
When the user request finishes operation in one of the services and travels to another one, a trace ID is passed along, unique for every request. This way, you can correlate information about your requests easily across your entire architecture.
What is OpenTelemetry?
OpenTelemetry is a set of APIs, SDKs, libraries, and integrations that is aiming to standardize the generation, collection, and management of telemetry data(logs, metrics, and traces). OpenTelemetry is a Cloud Native Computing Foundation project created after the merger of OpenCensus(from Google) and OpenTracing(from Uber).
Five things to know about OpenTelemetry
Now that you understand a little bit about both OpenTelemetry and distributed tracing, let us see a list of things you must know about OpenTelemetry tracing:
Backed by major cloud vendors
OpenTelemetry is an open-source project under Cloud Native Computing Foundation backed by major cloud providers like Microsoft and Google. As such, it has a wide community support as well as support by most APM and observability vendors.Reduced overhead for telemetry data
OpenTelemetry reduces overhead from your application to create and manage telemetry data. Your application is decoupled from OpenTelemetry implementation as OpenTelemetry provides an API to interact with. Telemetry is collected by otel-collectors which can receive, process and export data in multiple data formats.OpenTelemetry Tracing API is stable
OpenTelemetry has stable tracing API release in Java, .NET, Javascript, Python, and Erlang.Vendor-agnostic data formats
OpenTelemetry provides an otel-collector that can be used to receive trace data in multiple formats. Otel-collector also provides processors and exporters using which you can choose to export the collected data in your required format.Easy set-up and implementation
OpenTelemetry libraries come with default support for tracing. You just need to configure OpenTelemetry collectors via a config file to collect traces data in the format you prefer.
Steps involved in implementing OpenTelemetry tracing
OpenTelemetry provides auto-instrumentation libraries in multiple languages. With auto-instrumentation, you can get started with tracing without making any changes to your code.
For example OpenTelemetry Java JAR agent can detect a number of popular libraries and frameworks and instrument it right out of the box for generating telemetry data.
You can also instrument your code manually to have more business specific context. Let's look at the steps involved in tracing code using OpenTelemetry API:
-
Get a
TracerThe first step is to acquire aTracer. TheTraceris responsible for creating spans.
   Tracer tracer =
    openTelemetry.getTracer("instrumentation-library-name", "1.0.0");
- Create a span Creating a span only involves naming it. The start and end time is managed by the OpenTelemetry SDK.
   Span span = tracer.spanBuilder("my span").startSpan();
   // put the span into the current Context
   try (Scope scope = span.makeCurrent()) {
    // your use case
    ...
   } catch (Throwable t) {
    span.setStatus(StatusCode.ERROR, "Change it to your error message");
   } finally {
    span.end(); // closing the scope does not end the span, this has to be done manually
   }
-
Create nested spans
There can be multiple logical operations inside a service for which you might want to measure things like duration or custom attributes. OpenTelemetry supports tracing within processes. Example of a method
Acalling methodBwhere spans are linked manually:
   void parentOne() {
   Span parentSpan = tracer.spanBuilder("parent").startSpan();
   try {
    childOne(parentSpan);
   } finally {
    parentSpan.end();
     }
   }

   void childOne(Span parentSpan) {
   Span childSpan = tracer.spanBuilder("child")
        .setParent(Context.current().with(parentSpan))
        .startSpan();
   // do stuff
   childSpan.end();
   }
- Add span attributes With OpenTelemetry, you can add attributes on span to get additional context. Attributes provide additional context on the specific operation it tracks.
   Span span = tracer.spanBuilder("/resource/path").setSpanKind(SpanKind.CLIENT).startSpan();
   span.setAttribute("http.method", "GET");
   span.setAttribute("http.url", url.toString());
- Context propagation OpenTelemetry context propagation is based on W3C Trace Context HTTP headers. The W3C trace context specification defines standard HTTP headers to propagate context information that enables distributed tracing.
How to get started with OpenTelemetry tracing?
OpenTelemetry is becoming the world standard for instrumenting application code due to its multi-language support and ease of use. But OpenTelemetry helps only to generate and collect telemetry data. You need to export the telemetry data to a backend analysis tool so that your teams can store, query, and visualize the collected data.
And that's where SigNoz comes into the picture. SigNoz uses OpenTelemetry natively to instrument application codes. OpenTelemetry collector then sends the data to the SigNoz backend, where users have the option to choose between ClickHouse or Kafka+Druid as their telemetry data storage option.
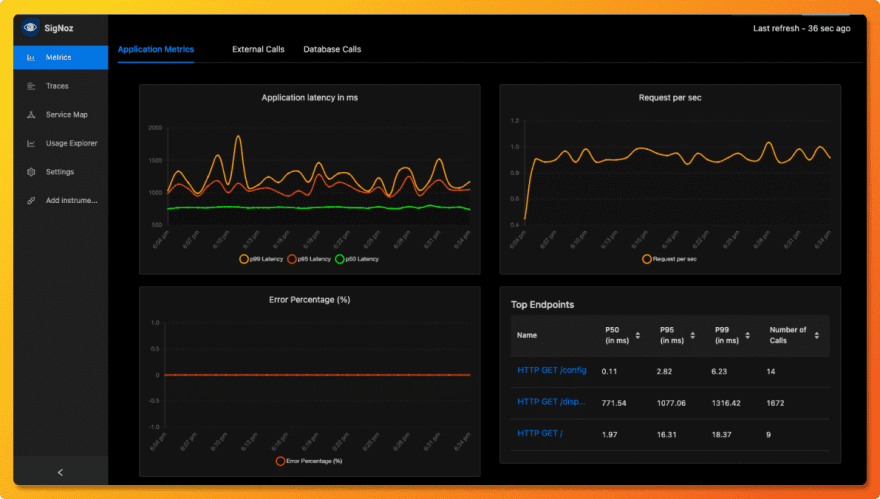
SigNoz comes with out of box visualization of things like RED metrics. There is a unified UI of metrics and traces, unlike Prometheus, so that you can easily identify the root cause of issues causing things like latency in your apps.
You can check out SigNoz's GitHub repo here 👇


Top comments (0)