Nodejs is a popular Javascript runtime environment that executes Javascript code outside of a web browser. Express is the most popular web frameworks that sits on top of Nodejs and adds functionalities like middleware, routing, etc. to Nodejs.
You can monitor your express application using OpenTelemetry and a tracing backend of your choice. OpenTelemetry is the leading open-source standard under the Cloud Native Computing Foundation that aims to standardize the process of instrumentation across multiple languages.
In this article, we will be using SigNoz to store and visualize the telemetry data collected by OpenTelemetry from a sample Expressjs application.
Running an Express application with OpenTelemetry
OpenTelemetry is a set of tools, APIs, and SDKs used to instrument applications to create and manage telemetry data(logs, metrics, and traces).
Install SigNoz
You can get started with SigNoz using just three commands at your terminal if you have Docker installed. You can install Docker from its official website.
git clone https://github.com/SigNoz/signoz.git
cd signoz/deploy/
./install.sh
You will have an option to choose between ClickHouse or Kafka + Druid as a storage option. Trying out SigNoz with ClickHouse database takes less than 1.5GB of memory, and for this tutorial, we will use that option.

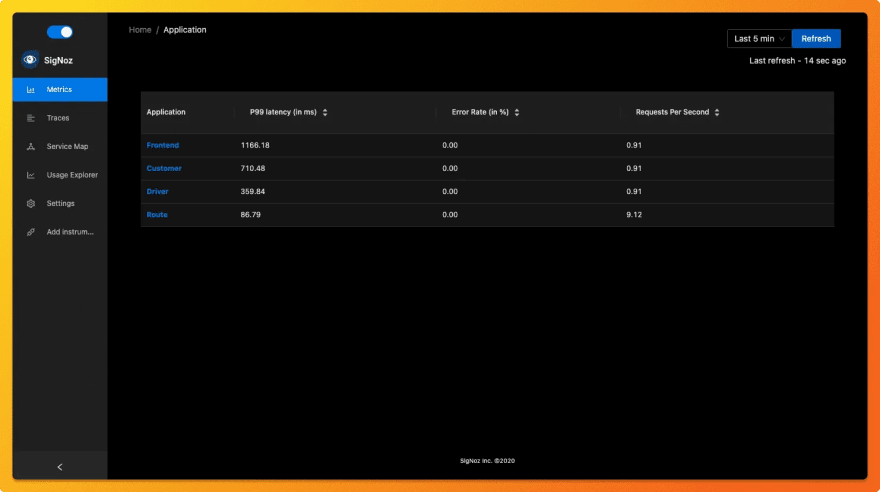
When you are done installing SigNoz, you can access the UI at: http://localhost:3000
The application list shown in the dashboard is from a sample app called HOT R.O.D that comes bundled with the SigNoz installation package.
Creating a sample express application
You need to ensure that you have Node.js version 12 or newer.
Download latest version of Nodejs.
For the sample application, let's create a basic 'hello world' express.js application.
Steps to get the app set up and running:
Make a directory and install express
Make a directory for your sample app on your machine. Then open up the terminal, navigate to the directory path and install express with the following command:
npm i express
Setup server.js
Create a file called server.js in your directory and with any text editor setup your Hello World file with the code below:
   const express = require('express');

   const app = express();

   app.get('/hello', (req, res) => {

   res.status(200).send('Hello World');

   });

   app.listen(9090);
Boot up the server with the following command on the terminal:
node server.js
You can check if your app is working by visiting: http://localhost:9090/hello

You can then stop the server from running using Ctrl + C.
Instrumenting the express application with OpenTelemetry
Install OpenTelemetry launcher package
In the same directory path at the terminal, install the OpenTelemetry launcher package with this command:
npm install lightstep-opentelemetry-launcher-node
The OpenTelemetry launcher makes getting started with OpenTelemetry easier by reducing configuration boilerplate.
Using OpenTelemetry SDK
To use OpenTelemetry, you need to start the OpenTelemetry SDK before loading your application. By initializing OpenTelemetry first, we enable OpenTelemetry to apply available instrumentation and auto-detect packages before the application starts to run. To do that, go to your directory and create a new file named, "server_init.js". This will act as the new entry point for your app. Paste the following code in the file:
   const {

  lightstep,

  opentelemetry,

  } = require('lightstep-opentelemetry-launcher-node');

  const sdk = lightstep.configureOpenTelemetry();

  sdk.start().then(() => {

  require('./server');

  });

  function shutdown() {

  sdk.shutdown().then(

  () => console.log("SDK shut down successfully"),

  (err) => console.log("Error shutting down SDK", err),

  ).finally(() => process.exit(0))

  };

  process.on('exit', shutdown);

  process.on('SIGINT', shutdown);

  process.on('SIGTERM', shutdown);
Pass the necessary environment variable
Once the file is created, you only need to run one last command at your terminal, which passes the necessary environment variables. Here, you also set SigNoz as your backend analysis tool.
OTEL_EXPORTER_OTLP_SPAN_ENDPOINT="http://<IP of SigNoz Backend>:55681/v1/trace" OTEL_METRICS_EXPORTER=none LS_SERVICE_NAME=<service name> node server_init.js
Replacing the placeholders in the above command for local host:
IP of SigNoz Backend: localhost (since we are running SigNoz on our local host)
service name : express_app (you can give whatever name that suits you)
So the final command is:
OTEL_EXPORTER_OTLP_SPAN_ENDPOINT="http://localhost:55681/v1/trace" OTEL_METRICS_EXPORTER=none LS_SERVICE_NAME=express_app node server_init.js
And congratulations! You have now instrumented your express application with OpenTelemetry.
Below you can find your express_app in the list of applications being monitored. You might have to hit the endpoint at http://localhost:9090/hello multiple times to generate some load before you see your app on the SigNoz dashboard.

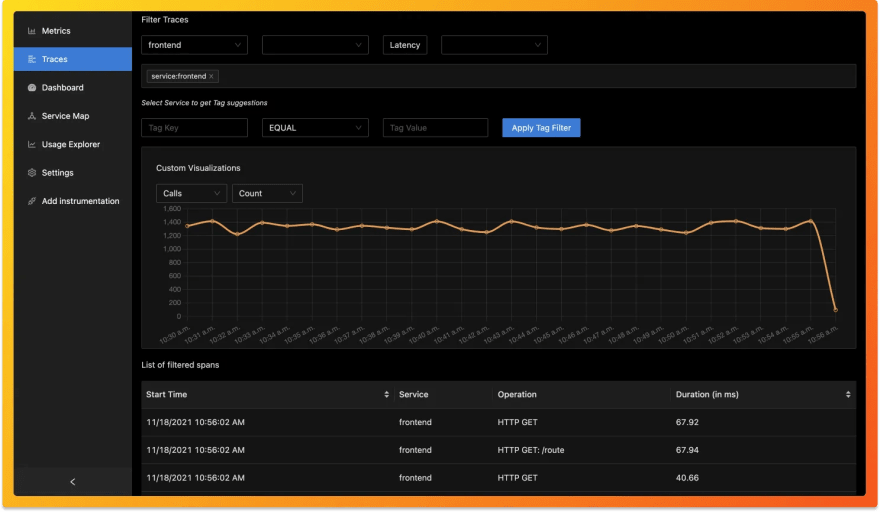
SigNoz is open-source, and a full-stack APM. It comes with charts of RED metrics and a seamless transition from metrics to traces.
Open-source tool to visualize telemetry data
SigNoz makes it easy to visualize metrics and traces captured through OpenTelemetry instrumentation.
SigNoz comes with out of box RED metrics charts and visualization. RED metrics stands for:
- Rate of requests
- Error rate of requests
- Duration taken by requests

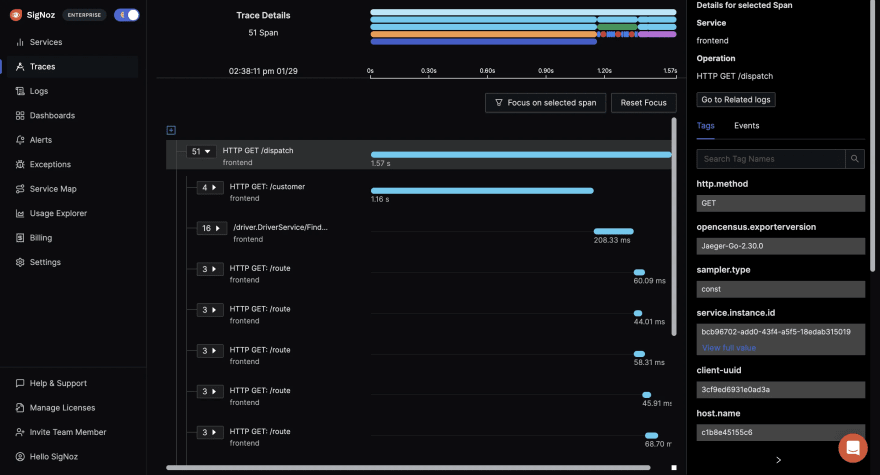
You can then choose a particular timestamp where latency is high to drill down to traces around that timestamp.
You can use flamegraphs to exactly identify the issue causing the latency.
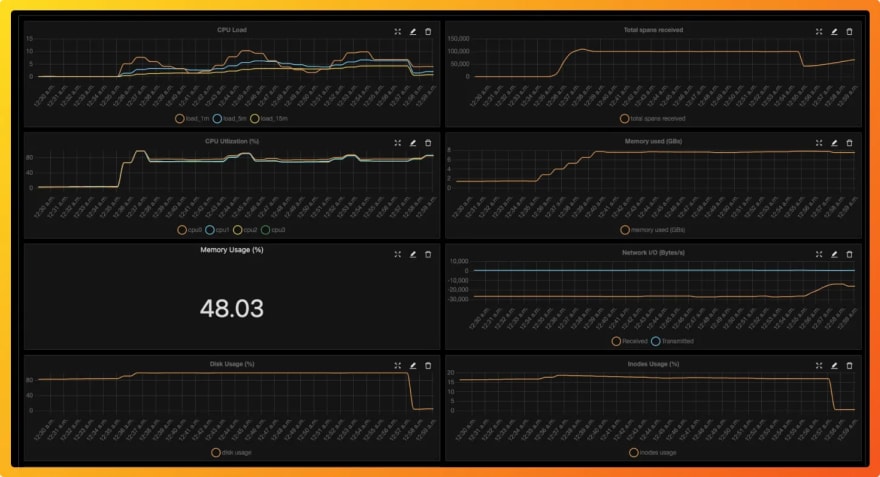
You can also build custom metrics dashboard for your infrastructure.
Conclusion
OpenTelemetry makes it very convenient to instrument your Express application. You can then use an open-source APM tool like SigNoz to analyze the performance of your app. As SigNoz offers a full-stack observability tool, you don't have to use multiple tools for your monitoring needs.
You can try out SigNoz by visiting its GitHub repo 👇
If you have any questions or need any help in setting things up, join our slack community and ping us in #help channel.

If you want to read more about SigNoz 👇


Top comments (0)