OpenTelemetry is a vendor-agnostic instrumentation library under CNCF. It can be used to instrument your Python applications to generate telemetry data. Let's learn how it works and see how to visualize that data with SigNoz.
The cost of a millisecond.
TABB Group, a financial services industry research firm, estimates that if a broker's electronic trading platform is 5 milliseconds behind the competition, it could cost $4 million in revenue per millisecond.
The cost of latency is too high in the financial services industry, and the same is true for almost any software-based business today. Half a second is enough to kill user satisfaction to a point where they abandon an app's service.
Capturing and analyzing data about your production environment is critical. You need to proactively solve stability and performance issues in your web application to avoid system failures and ensure a smooth user experience.
In a microservices architecture, the challenge is to solve availability and performance issues quickly. You need observability for your applications. And, observability is powered with telemetry data.
What is OpenTelemetry?
OpenTelemetry emerged as a single project after the merging of OpenCensus(from Google) and OpenTracing(from Uber) into a single project. The project aims to make telemetry data(logs, metrics, and traces) a built-in feature of cloud-native software applications.
OpenTelemetry has laguage-specific implementation for generating telemetry data which includes OpenTelemetry Python libraries.
You can check out the current releases of opentelemetry-python.
OpenTelemetry only generates telemetry data and lets you decide where to send your data for analysis and visualization. In this article, we will be using SigNoz - an open-source full-stack application performance monitoring tool as our analysis backend.
Steps to get started with OpenTelemetry for a Python application:
- Installing SigNoz
- Installing sample Python app
- Instrumentation with OpenTelemetry and sending data to SigNoz
Installing SigNoz
You can get started with SigNoz using just three commands at your terminal if you have Docker installed. You can read about other deployment options from SigNoz documentation.
git clone https://github.com/SigNoz/signoz.git
cd signoz/deploy/
./install.sh
You will have an option to choose between ClickHouse or Kafka + Druid as a storage option. Trying out SigNoz with ClickHouse database takes less than 1.5GB of memory, and for this tutorial, we will use that option.
When you are done installing SigNoz, you can access the UI at: http://localhost:3000
The application list shown in the dashboard is from a sample app called HOT R.O.D that comes bundled with the SigNoz installation package.

Installing sample Python app
Prerequisites
Python 3.4 or newer
If you do not have Python installed on your system, you can download it from the link. Check the version of Python usingpython3 --versionon your terminal to see if Python is properly installed or not.MongoDB
If you already have MongoDB services running on your system, you can skip this step.
For macOS:
Download link: https://docs.mongodb.com/manual/tutorial/install-mongodb-on-os-x/
For Linux: https://docs.mongodb.com/manual/administration/install-on-linux/
For Windows: https://docs.mongodb.com/manual/tutorial/install-mongodb-on-windows/
On MacOS the installation is done using Homebrew's brew package manager. Once the installation is done, don't forget to start MongoDB services using brew services start mongodb/brew/mongodb-community@4.4 on your macOS terminal.

Steps to get the Python app up and running
- Clone sample Flask app repository and go to the root folder
   git clone https://github.com/SigNoz/sample-flask-app.git
   cd sample-flask-app
- Check if the app is running
python3 app.py

You can now access the UI of the app on your local host: http://localhost:5000/

Instrumentation with OpenTelemetry and sending data to SigNoz
- Opentelemetry Python instrumentation installation Your app folder contains a file called requirements.txt. This file contains all the necessary commands to set up OpenTelemetry Python instrumentation. All the mandatory packages required to start the instrumentation are installed with the help of this file. Make sure your path is updated to the root directory of your sample app and run the following command:
pip3 install -r requirements.txt
If it hangs while installing grpcio during pip3 install opentelemetry-exporter-otlp then follow below steps as suggested in this stackoverflow link.
- pip3 install --upgrade pip
- python3 -m pip install --upgrade setuptools
- pip3 install --no-cache-dir --force-reinstall -Iv grpcio
- Install application specific packages This step is required to install packages specific to the application. Make sure to run this command in the root directory of your installed application. This command figures out which instrumentation packages the user might want to install and installs it for them:
opentelemetry-bootstrap --action=install
- Configure a span exporter and run your application You're almost done. In the last step, you just need to configure a few environment variables for your OTLP exporters. Environment variables that need to be configured:
- SERVICE_NAME - application service name (you can name it as you like)
- ENDPOINT_ADDRESS - OTLP gRPC collector endpoint address (IP of SigNoz)
After taking care of these environment variables, you only need to run your instrumented application.
Accomplish all these by using the following command at your terminal.
OTEL_RESOURCE_ATTRIBUTES=service.name=pythonApp OTEL_METRICS_EXPORTER=none OTEL_EXPORTER_OTLP_ENDPOINT="http://<IP of SigNoz>:4317" opentelemetry-instrument python3 app.py
Ip of SigNoz can be replaced with localhost in this case. Hence, the final command becomes:
OTEL_RESOURCE_ATTRIBUTES=service.name=pythonApp OTEL_METRICS_EXPORTER=none OTEL_EXPORTER_OTLP_ENDPOINT="http://localhost:4317" opentelemetry-instrument python3 app.py
And, congratulations! You have instrumented your sample Python app. You can now access the SigNoz dashboard at http://localhost:3000 to monitor your app for performance metrics.

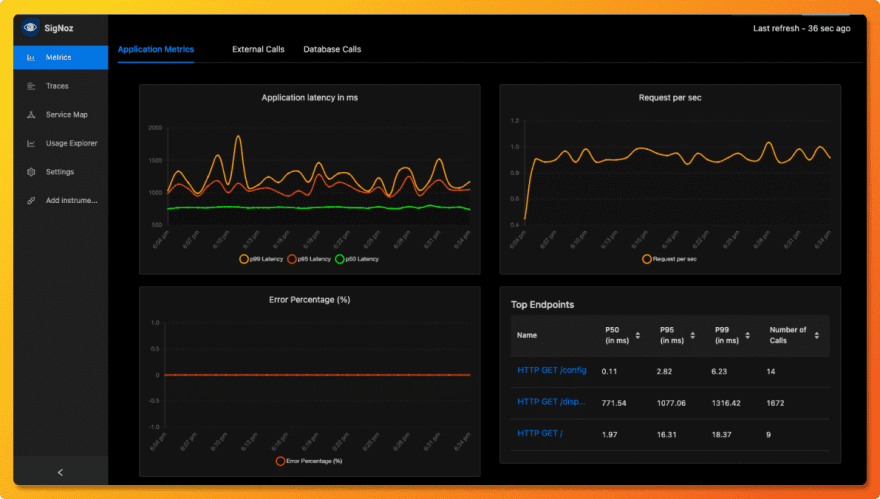
Metrics and Traces of the Python application
SigNoz makes it easy to visualize metrics and traces captured through OpenTelemetry instrumentation.
SigNoz comes with out of box RED metrics charts and visualization. RED metrics stands for:
- Rate of requests
- Error rate of requests
- Duration taken by requests
You can then choose a particular timestamp where latency is high to drill down to traces around that timestamp.

You can use flamegraphs to exactly identify the issue causing the latency.

Conclusion
OpenTelemetry makes it very convenient to instrument your Python application. You can then use an open-source APM tool like SigNoz to analyze the performance of your app. As SigNoz offers a full-stack observability tool, you don't have to use multiple tools for your monitoring needs.
You can try out SigNoz by visiting its GitHub repo 👇
If you face any issues while trying out SigNoz, feel free to write to us at: support@signoz.io
If you want to read more about SigNoz 👇


Top comments (0)