Both DataDog and New Relic are enterprise monitoring tools that provide a wide range of products covering different aspects of application and infrastructure monitoring. In this article, we will compare DataDog and New Relic based on their different monitoring capabilities.
Businesses are embracing digital transformation now more than ever. In most cases, the digital channel is the primary driver of revenue and growth. Customers and end-users are going online to fulfill both their daily and long-term needs.
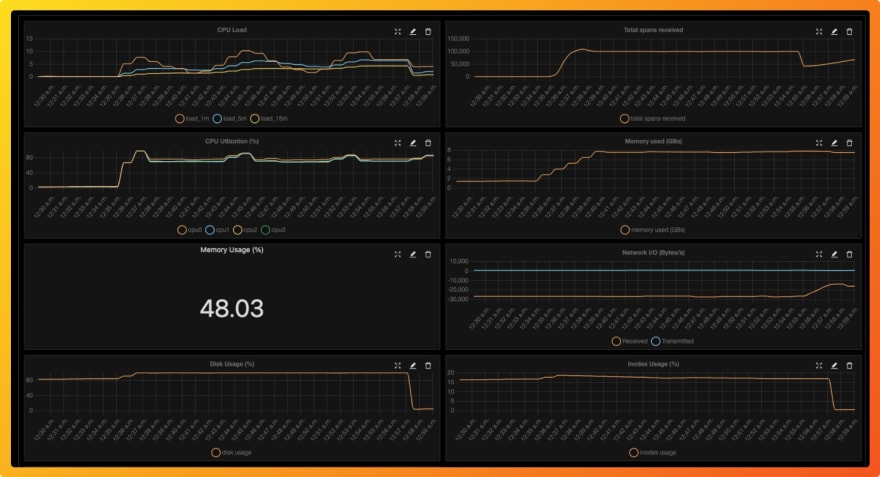
The digital shift has made the app production environment a critical piece of an organization's success. The performance of your application in production needs to be monitored to ensure high availability at all times.
DataDog and New Relic provide numerous products to monitor applications. Some of the key products offered by both tools include:
- Application Performance Monitoring
- Infrastructure monitoring
- Log Management
- Network monitoring
- Browser or end-user monitoring
Let's compare DataDog and New Relic based on the features they provide in the above-mentioned categories.
You can also check out SigNoz, an open-source APM tool. It is built natively for OpenTelemetry and supports multiple backend storage - ClickHouse or Kafka + Druid. Choosing an open-source APM over SaaS vendors has many benefits for developers. At the same time, SigNoz is built to avoid the pain of maintenance that comes with most open-source tools.
Application Performance Monitoring
DataDog APM
DataDog's APM provides end-to-end distributed tracing connecting frontend devices to databases.
Some of the key features of DataDog APM includes:
- Distributed tracing can track requests from user sessions to services and databases.
- Users can correlate their distributed traces to infrastructure and network metrics.
- With DataDog's APM, you can ingest 100% of your traces from the last 15 minutes. You can then retain error and high latency traces
- You can inspect code-level performance and break down slow requests.
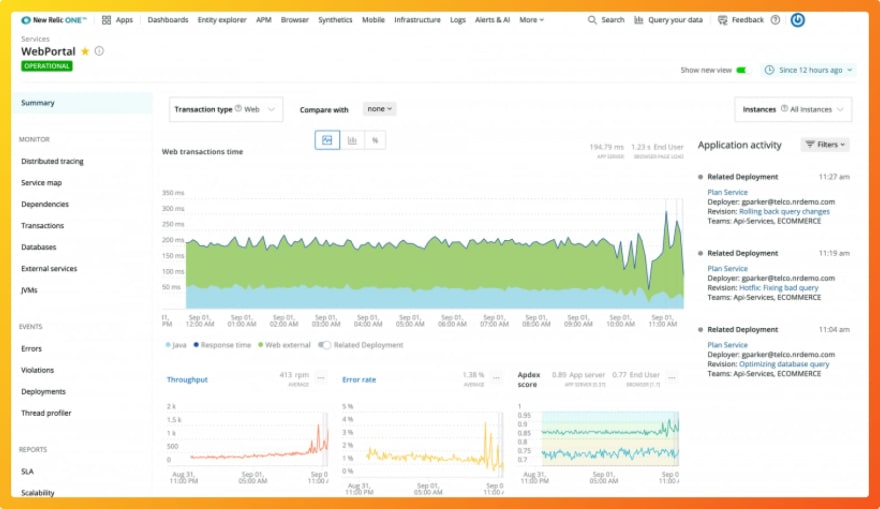
New Relic APM
New Relic's APM covers performance monitoring for many programming languages and combines metrics from mobile and browser apps to services and databases.
Some of the key features of New Relic APM includes:
- Auto-instrumentation of eight programming languages: Java, .Net, Node.js, PHP, Python, Ruby, Go and C/C++
- Distributed tracing and sampling options for a wide range of technology stack
- Correlation of tracing data with other aspects of application infrastructure and user monitoring
- Fully managed cloud-native experience with on-demand scalability
Infrastructure Monitoring
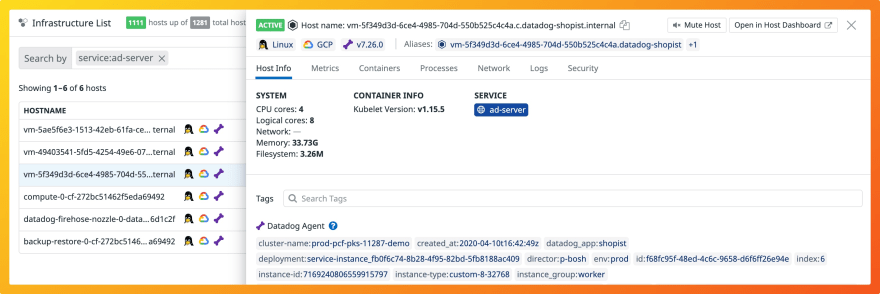
DataDog Infrastructure Monitoring
You can monitor all your machines with DataDog's infrastructure monitoring. A DataDog agent runs on all your hosts to capture events and metrics.
Some of the key features of DataDog's infrastructure monitoring includes:
- You can see all your machines in the infrastructure list. Each machine/host has tags, aliases, metrics attached to it
- DataDog provides a Host map to visualize all your hosts on one screen
- It also provides a container map and real-time monitoring of containers
New Relic Infrastructure Monitoring
New Relic provides infrastructure monitoring for cloud services, dedicated hosts to containers.
Some of the key features of New Relic infrastructure monitoring includes:
- You can connect changes in your host performance with your configuration changes. You can track the configuration change of your entire infrastructure.
- If your infrastructure account is connected with the APM account, then you can troubleshoot performance issues by connecting the server-side to the application side.
- Provides integrations to collect metrics for popular platforms like AWS, GCP, Azure, Kubernetes, etc.

Log Management
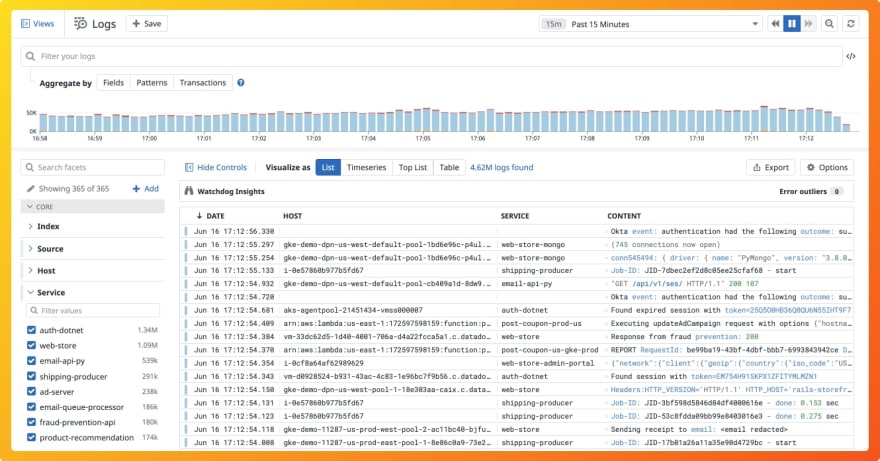
DataDog Log Management
DataDog log management provides capabilities to search and analyze logs at any scale.
Some of the key features of DataDog Log Management includes:
- Provides logging without limits, can ingest 100% of your logs before indexing.
- Provides log processing pipelines for 170+ common technologies
- Filter logs with a time range, tags, and full-text search
- Provides aggregation of indexed logs
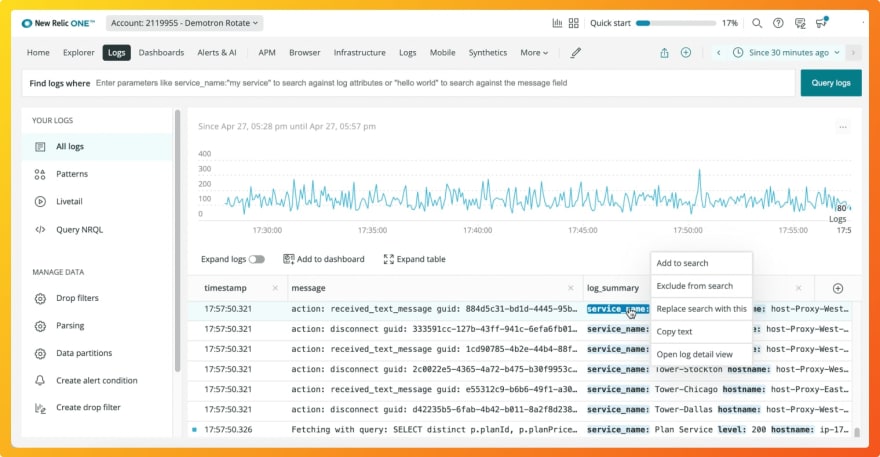
New Relic Log Management
With New Relic Log Management, you can easily ingest any text-based data.
Some of the key features of New Relic log management include:
- Custom charts and visualization for log data
- Quick search response times for any volume of log data
- Provides machine learning capabilities to detect issues from your log data automatically
Network Monitoring
DataDog Network Monitoring
Some of the key features of DataDog network monitoring include:
- Provides metrics for point-to-point communication on your infrastructure
- Granular data for network flows in a multi-cloud environment along with aggregation capabilities supported by tags
- Automatically collects tags from more than 450 integrations. You can see network volume between any two sets of tags

New Relic Network Monitoring
Some of the key features of New Relic Network monitoring include:
- Provides pre-configured dashboards for monitoring popular cloud services like Azure, AWS, GCP, etc. and provides dynamic alerting
- Provides integrations with 100+ services. You can check the full list of AWS, Azure and GCP integrations
- Provides advanced Kubernetes monitoring capabilities correlating metrics from the application and the infrastructure

Browser or real-user monitoring
DataDog Real-User Monitoring
DataDog provides end-to-end visibility into user journeys for mobile and web applications.
Some of the key features of DataDog end-user monitoring:
- Provides aggregated fronted performance metrics, with slice and dice capabilities by location, device, application, etc.
- Provides root cause analysis for slow loading times with visibility into code, network, and infrastructure
- Offers customer segmentation with the help of tags for error tracking in real-time

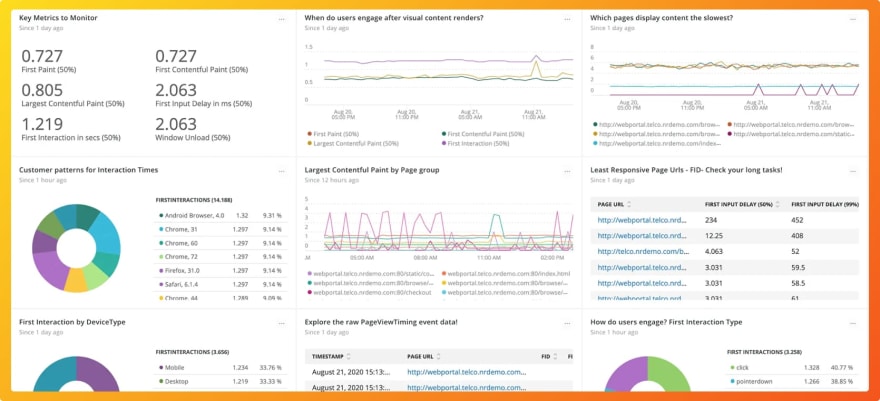
New Relic Browser Monitoring
New Relic provides monitoring for end-users using your application across web browsers, devices, operating systems, and networks.
Some of the key features of New Relic Browser Monitoring include:
- Provides full-stack visibility to identify end-user latency from backend or network issues
- Provides session performance with a heatmap of a user's interaction with the webpage
- Provides Javascript error analytics using which you can see end-user steps leading to errors
Issues with existing monitoring vendors
DataDog and New Relic are great monitoring tools and provide a gamut of monitoring products that any organization can use. But these enterprise monitoring tools can have the following issues:
- Crazy node-based pricing, Node-based pricing doesn’t make sense in today’s micro-services architecture. Any node which is live for more than 8hrs in a month is charged. So, unsuitable for spiky workloads
- Very costly These tools are very costly if you want to do things like sending custom metrics.
- Cloud-only Hence, not suitable for companies that have concerns with sending data outside their infra
- Closed product roadmap For any small feature, you are dependent on their roadmap. We think this is an unnecessary restriction for a product which developers use. A product used by developers should be extendible
The other alternative can be going for an open-source alternative. But the problem with most open-source products is that they are resource-intensive to set up, maintain and scale up. That's where SigNoz comes into the picture. SigNoz is a full-stack open-source APM platform with easy configuration and scalable architecture.
An alternative to DataDog and New Relic - SigNoz
SigNoz is a full-stack open-source application performance monitoring and observability tool which can be used in place of DataDog and New Relic. SigNoz is built to give SaaS like user experience combined with the perks of open-source software. Developer tools should be developer first, and SigNoz was built by developers to address the gap between SaaS vendors and open-source software.
Key architecture features:
- Native OpenTelemetry support SigNoz is built to support OpenTelemetry natively, which is quietly becoming the world standard to generate and manage telemetry data.
- Flexible and scalable Database storage SigNoz provides users flexibility in terms of storage. You can choose between ClickHouse or Kafka + Druid as your backend storage while installing SigNoz.

SigNoz comes with out of box visualization of things like RED metrics.

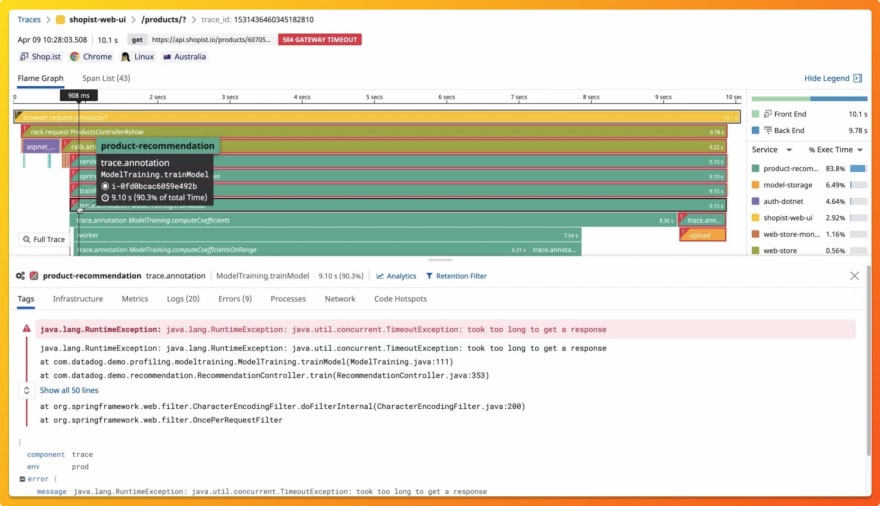
You can also use flamegraphs to visualize spans from your trace data. All of this comes out of the box with SigNoz.

You can also build custom metrics dashboard for your infrastructure.
Some of the things SigNoz can help you track:
- Application overview metrics like RPS, 50th/90th/99th Percentile latencies, and Error Rate
- Slowest endpoints in your application
- See exact request trace to figure out issues in downstream services, slow DB queries, call to 3rd party services like payment gateways, etc
- Filter traces by service name, operation, latency, error, tags/annotations.
- Run aggregates on trace data
- Unified UI for both metrics and traces
Getting started with SigNoz
If you have docker installed, getting started with SigNoz just takes three easy steps at the command line:
git clone https://github.com/SigNoz/signoz.git
cd signoz/deploy/
./install.sh
You can read more about deploying SigNoz from its documentation.

You can check out SigNoz's GitHub repo here 👇
Related Content
DataDog vs Prometheus
DataDog vs Grafana
Monitor Spring Boot App with SigNoz and OpenTelemetry


Top comments (1)
Great intro to SigNoz, thank you!