In A Practical Tracing Journey, I described how I added tracing to a real-world app to get insights on how I could improve performance. One of the conclusions was that I might be able to save some time by switching my HTTP client from got toundici, but we decided to experiment with it in depth before making a decision. Time for that.
Before we dive into the experiment, though, here's a look at what my New Relic dashboard looks like after running for a few days in production with tracing enabled:
It's pretty neat. The first graph shows the average response time (duration of a trace), the second shows how many traces I have per second (remember that this is a sample of my total requests), while the third shows error occurrences (it has a lot of false positives, though).
It's a good idea to get used to your observability tools and reports like this. As this article points out, they can help you get a feel for what's "normal" in your services, so you easily know when something is off.
They also provide insights that help you understand the behaviour of your services or users. For instance, you might find there's a correlation between the number of requests we get and the response time. But that's an observation, not a conclusion. Possible reasons might be: higher load, a specific kind of request input, targeted attacks etc. We could then investigate further by looking at the data in the traces in that time and maybe adding more instrumentation as needed.
Okay, now let's get on to the experiment.
Implementing
First, when a new request comes in, we'll randomly pick which client we'll use. It's important to do this at the start of the request and save the choice in the request context so we can access it from anywhere in the code.
function chooseHttpClient() {
    // There may be more sophisticated ways, but we'll do a simple Math.random()
    return Math.random() > 0.5 ? 'got' : 'undici';
}

// ...

const openTelemetry = require("@opentelemetry/sdk-node");

// Request handler: Pick a client and save it to the context
app.post('/fetch', async (req, res, next) => {
    const client = chooseHttpClient();

    // Save thechosen client as a span attribute so we can filter or group traces by it
    // for easy comparisons (in Zipkin or New Relic)
    span.setAttribute('external.client', client);

    // And save it to the context so we can access it in nested spans
    const context = openTelemetry.api.context.active().setValue(Symbol.for('external.client'), client);

    return openTelemetry.api.context.with(context, async () => {
        // Handle request...
        res.send(result);
    });
});
Then, later on in our code, when we need to make the external call, we retrieve the chosen client and use the corresponding library. It looks a bit tricky, but all we're doing is calling a different function and then normalizing the response from either library into the same shape:
function getChosenHttpClient() {
    return openTelemetry.api.context.active().getValue(Symbol.for('external.client'))
};

const got = require("got");
const undici = require('undici');

const makeRequest = (url) => {
    return wrapExternalCallInSpan('first external call', url, (span) => {
        let requestPromise;

        switch (getChosenHttpClient()) {
            case 'got':
                requestPromise = got(url, gotOptions).then(response => {
                    return [response.statusCode, response.body];
                });
                break;
            case 'undici':
                requestPromise = undici.request(url, undiciOptions).then(response => {
                    return Promise.all([response.statusCode, response.body.text()]);
                });
        }

        return requestPromise.then(([statusCode, body]) => {
            span.setAttribute('external.status_code', statusCode);
            // Do stuff with body
        }).catch(handleError)
            .finally(() => {
                span.end();
            });
};
Cool.
Running the experiment
Let's see the effect on my local machine. I'll use autocannon (my good friend from the concurrency series) to send 40 requests quickly. That should give us a good spread of got/undici requests.
autocannon --connections 5 --amount 40 \
  --body "The request body" --method POST \
  http://localhost:3000/fetch
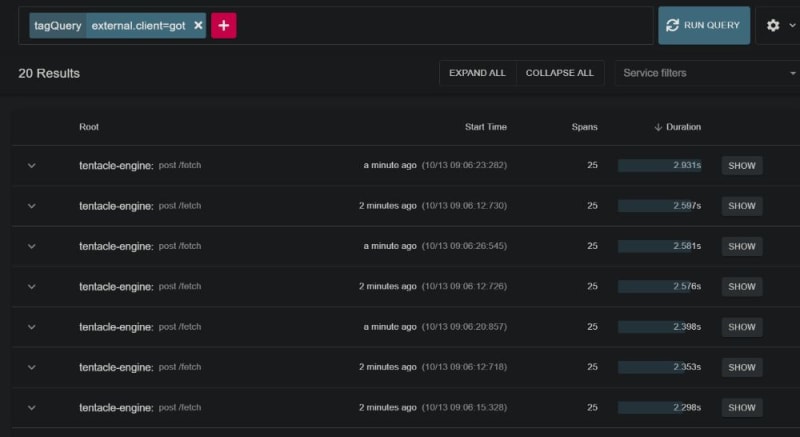
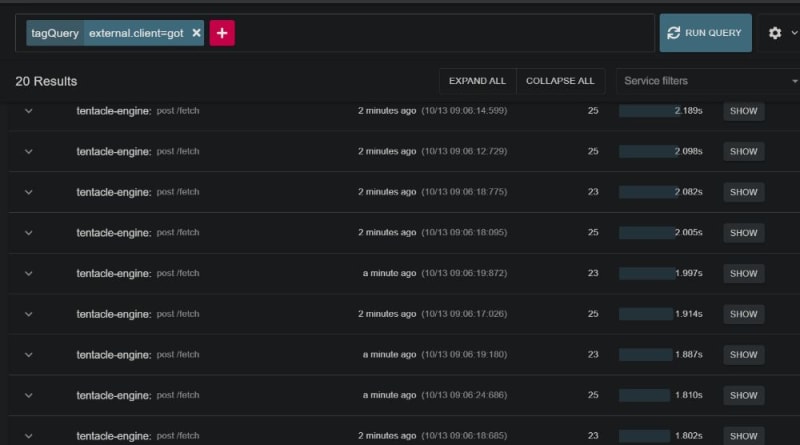
Then we open up Zipkin in two windows. In one, we filter for external.client=got; the other external.client=undici. I can't show all the requests, but here are the slowest and fastest for each. First, got:
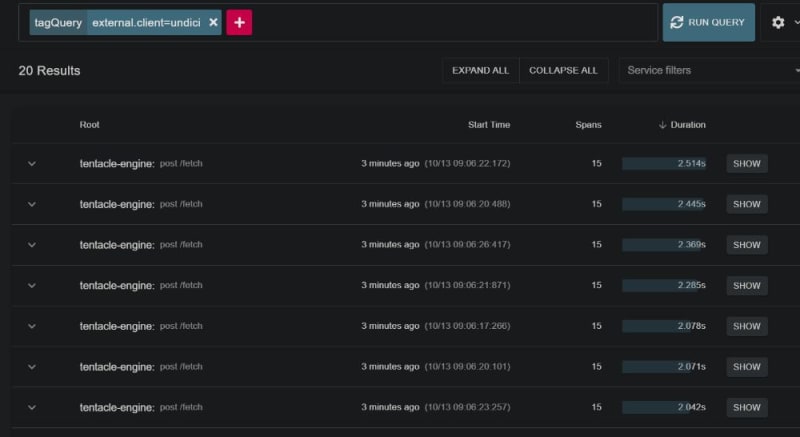
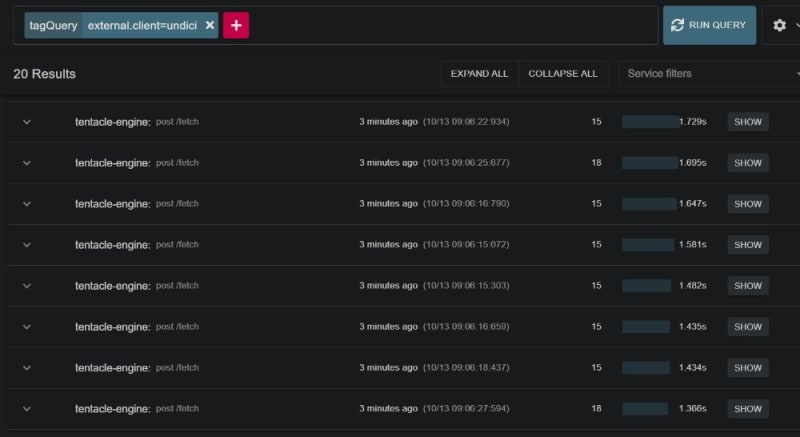
Then, undici:
(Btw, isn't it pretty neat that there are exactly 20 results for each type? Math.random() came through!😅)
Well...it looks like undici wins by a fair bit. The fastest got request here is 1.8s, and the slowest 2.9s. Meanwhile,undici has 13 requests under 2s, with the fastest at 1.355s.
Monitoring on production
At this point, you can say, "Cool, let's switch to undici." But if you have a large user base, and more complex flows, it might be better to go ahead with running the experiment in production first, for multiple reasons.
First off, experimenting in production will provide a more realistic benchmark—a greater sample size, with real-world usage patterns and server conditions. And with New Relic's graphs, I can more easily compare a large set of requests statistically.
Experimenting in production is a big boon for reliability. We can monitor other aspects of using undici (like unexpected errors, or things we missed when switching) without breaking our entire app. We'll enable the new kid (undici) for a fraction of users, while keeping the tested, reliable one (got) for most users. That way, if things go bad with undici, only a few users at most are affected.
In our code here, we're splitting equally between both clients (Math.random() > 0.5), but for larger userbases, you might want to try undici on a small fraction, maybe 0.3. As time goes on, and you gain more confidence in undici, you could gradually increase that faction to 1. I'd also recommend using an environment variable to specify the fraction, allowing you to adjust the split or switch clients without having to deploy a code change. For QA purposes, you could also use a special cookie or query parameter to "force" a specific client.
So let's deploy this to production, and monitor for a while to see how requests turn out.
After a few days of monitoring for errors and incorrect results, here are the traces, grouped by client.
The graph is a bit sparse because I only have a few days retention on New Relic, but as expected, the average response time for undici is generally lower. But we shouldn't look at the average alone. Let's check out the percentiles (why?): Here are the statistic breakdowns, first for got, then for undici:
You can see that not only is got's average time taken higher, its p95 also gets much higher (21s) than undici's (around 10s).
So, at this point, we can conclude that it's worth a switch; all that's left to do is to update our code finally (and still monitor in production afterwards). Yay!


Oldest comments (0)