
So, we’ve launched Druid, see Apache Druid: Overview, Running in Kubernetes, and Monitoring with Prometheus . So far, a local Apache Derby database is used as the default storage for metadata .
Next, we will switch Druid to PostgreSQL, and later we will remove ZooKeeper from the cluster setup.
To begin with, let’s start a PostgreSQL cluster in Kubernetes, add the PostgreSQL Exporter for Prometheus, and configure metrics collection.
We will launch again in Minikube , for PostgreSQL, we will use Zalando Operator , and will add the PostgreSQL Exporter as a sidecar container .
We will not dig deep into the Operator yet, although it is very interesting, so we will play with it somehow. For now, we just need to monitor it.
Documentation — Administrator Guide .
Starting the PostgreSQL operator
Create a namespace:
$ kubectl create ns postgres-operator
namespace/postgres-operator created
Add a Helm repository:
$ helm repo add postgres-operator-charts [https://opensource.zalando.com/postgres-operator/charts/postgres-operator](https://opensource.zalando.com/postgres-operator/charts/postgres-operator)
Install the operator itself:
$ helm -n postgres-operator install postgres-operator postgres-operator-charts/postgres-operator
If need, add a WebUI for the operator:
$ helm repo add postgres-operator-ui-charts [https://opensource.zalando.com/postgres-operator/charts/postgres-operator-ui](https://opensource.zalando.com/postgres-operator/charts/postgres-operator-ui)

$ helm -n postgres-operator install postgres-operator-ui postgres-operator-ui-charts/postgres-operator-ui
Check pods:
$ kubectl -n postgres-operator get pods
NAME READY STATUS RESTARTS AGE
postgres-operator-649799f4bd-dz5bl 1/1 Running 0 82s
postgres-operator-ui-5cfff55c65-v4bjj 1/1 Running 0 22s
Provide access for yourself to the Operator’s web intrerface service:
$ kubectl port-forward svc/postgres-operator-ui 8081:80
Forwarding from 127.0.0.1:8081 -> 8081
Forwarding from [::1]:8081 -> 8081
Check it:

We will not do anything here, will take ready-made examples of the cluster configuration.
Starting a PostgreSQL cluster
Clone the Operator’s repository:
$ git clone [https://github.com/zalando/postgres-operator.git](https://github.com/zalando/postgres-operator.git)
cd postgres-operator/
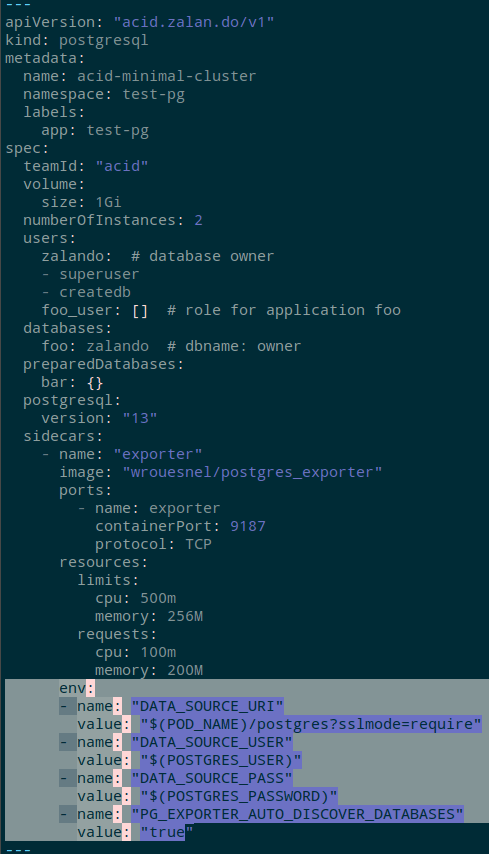
There are several examples in the manifests catalog, let's take the manifests/minimal-master-replica-svcmonitor.yaml file - it describes a namespace, a cluster, user, databases, two Service, and two ServiceMonitors + Sidecars with Prometheus Exporter.
Apply it:
$ kubectl apply -f manifests/minimal-master-replica-svcmonitor.yaml
namespace/test-pg created
postgresql.acid.zalan.do/acid-minimal-cluster created
service/acid-minimal-cluster-svc-metrics-master created
service/acid-minimal-cluster-svc-metrics-replica created
servicemonitor.monitoring.coreos.com/acid-minimal-cluster-svcm-master created
servicemonitor.monitoring.coreos.com/acid-minimal-cluster-svcm-replica created
Check the cluster:
$ kubectl -n test-pg get postgresql
NAME TEAM VERSION PODS VOLUME CPU-REQUEST MEMORY-REQUEST AGE STATUS
acid-minimal-cluster acid 13 2 1Gi 2m21s Running
Its Pods:
$ kubectl -n test-pg get po
NAME READY STATUS RESTARTS AGE
acid-minimal-cluster-0 2/2 Running 0 37s
acid-minimal-cluster-1 1/2 Running 0 24s
Each one has its own role, which is set in the labels - spilo-role=master or spilo-role=replica.
PostgreSQL users
See docs here>>> and here>>> .
Users are described in the — surprise — users block:
$ kubectl -n test-pg get postgresql -o yaml
…
users:
foo_user: []
zalando:
- superuser
- createdb
…
And Operator will create a dedicated Kubernetes Secret for each of them:
$ kubectl -n test-pg get secret
NAME TYPE DATA AGE
foo-user.acid-minimal-cluster.credentials.postgresql.acid.zalan.do Opaque 2 38m
postgres.acid-minimal-cluster.credentials.postgresql.acid.zalan.do Opaque 2 38m
standby.acid-minimal-cluster.credentials.postgresql.acid.zalan.do Opaque 2 38m
zalando.acid-minimal-cluster.credentials.postgresql.acid.zalan.do Opaque 2 38m
Which are then mapped to pods through variables:
$ kubectl -n test-pg get statefulsets acid-minimal-cluster -o yaml
…
- env:
- name: POD_NAME
valueFrom:
fieldRef:
apiVersion: v1
fieldPath: metadata.name
- name: POD_NAMESPACE
valueFrom:
fieldRef:
apiVersion: v1
fieldPath: metadata.namespace
- name: POSTGRES_USER
value: postgres
- name: POSTGRES_PASSWORD
valueFrom:
secretKeyRef:
key: password
name: postgres.acid-minimal-cluster.credentials.postgresql.acid.zalan.do
…
Well, let’s check.
Let’s get the password:
$ kubectl -n test-pg get secret postgres.acid-minimal-cluster.credentials.postgresql.acid.zalan.do -o ‘jsonpath={.data.password}’ | base64 -d
CcWdAaqvPA8acxwIpVyM8UHkds2QG3opC3KD7rO1TxITQ1q31cwYLTswzfBeTVsN
Open its port to access it locally:
$ kubectl -n test-pg port-forward acid-minimal-cluster-0 6432:5432
Log in and check the databases:
$ psql -U postgres -h localhost -p 6432
Password for user postgres:
psql (14.5, server 13.7 (Ubuntu 13.7–1.pgdg18.04+1))
SSL connection (protocol: TLSv1.3, cipher: TLS_AES_256_GCM_SHA384, bits: 256, compression: off)
Type “help” for help.
postgres=# \l
List of databases
Name | Owner | Encoding | Collate | Ctype | Access privileges
 — — — — — -+ — — — — — -+ — — — — — + — — — — — — -+ — — — — — — -+ — — — — — — — — — — — -
bar | bar_owner | UTF8 | en_US.utf-8 | en_US.utf-8 |
foo | zalando | UTF8 | en_US.utf-8 | en_US.utf-8 |
postgres | postgres | UTF8 | en_US.utf-8 | en_US.utf-8 |
template0 | postgres | UTF8 | en_US.utf-8 | en_US.utf-8 | =c/postgres +
| | | | | postgres=CTc/postgres
template1 | postgres | UTF8 | en_US.utf-8 | en_US.utf-8 | =c/postgres +
| | | | | postgres=CTc/postgres
(5 rows)
postgres=#
PostgreSQL Prometheus Exporter
See Sidecar definitions .
We already have a sidecar — it was added from the manifest, and in each Pod, we currently have two containers — PostgreSQL itself, and its Exporter:
$ kubectl -n test-pg get po acid-minimal-cluster-0 -o jsonpath=’{.spec.containers[*].name}’
postgres exporter
Let’s see if there are metrics there — open the port:
$ kubectl -n test-pg port-forward svc/acid-minimal-cluster-svc-metrics-master 9187:9187
Forwarding from 127.0.0.1:9187 -> 9187
Forwarding from [::1]:9187 -> 9187
And we see that we do not see anything, and the cluster is kind of “dead” - pg_up == 0:
$ curl -s localhost:9187/metrics | grep pg_ | grep -v ‘#’
pg_exporter_last_scrape_duration_seconds 1.00031302
pg_exporter_last_scrape_error 1
pg_exporter_scrapes_total 9
pg_up 0
Why — because the exporter must have access data, i.e. login-password.
In the configuration of the sidecar, add new variables, see Environment Variables :
...
      env:
      - name: "DATA_SOURCE_URI"
        value: "$(POD_NAME)/postgres?sslmode=require"
      - name: "DATA_SOURCE_USER"
        value: "$(POSTGRES_USER)"
      - name: "DATA_SOURCE_PASS"
        value: "$(POSTGRES_PASSWORD)"
      - name: "PG_EXPORTER_AUTO_DISCOVER_DATABASES"
        value: "true"
...
That is, the Operator creates a StatefulSet in which it sets the variables POSTGRES_USER and POSTGRES_PASSWORD, which we use for the sidecar to set its own variables.
Save updates and apply them:
$ kubectl apply -f manifests/minimal-master-replica-svcmonitor.yaml
Check the variables in the pod itself:
$ kubectl -n test-pg get po acid-minimal-cluster-0 -o yaml
…
- env:
- name: POD_NAME
valueFrom:
fieldRef:
apiVersion: v1
fieldPath: metadata.name
- name: POD_NAMESPACE
valueFrom:
fieldRef:
apiVersion: v1
fieldPath: metadata.namespace
- name: POSTGRES_USER
value: postgres
- name: POSTGRES_PASSWORD
valueFrom:
secretKeyRef:
key: password
name: postgres.acid-minimal-cluster.credentials.postgresql.acid.zalan.do
- name: DATA_SOURCE_URI
value: $(POD_NAME)/postgres?sslmode=require
- name: DATA_SOURCE_USER
value: $(POSTGRES_USER)
- name: DATA_SOURCE_PASS
value: $(POSTGRES_PASSWORD)
- name: PG_EXPORTER_AUTO_DISCOVER_DATABASES
value: “true”
…
And check the metrics again in the exporter:
$ curl -s localhost:9187/metrics | grep pg_ | grep -v ‘#’ | tail -5
pg_stat_replication_pg_current_wal_lsn_bytes{application_name=”acid-minimal-cluster-0",client_addr=”172.17.0.17",server=”acid-minimal-cluster-1:5432",slot_name=”182",state=”streaming”} 1.52655344e+08
pg_stat_replication_pg_wal_lsn_diff{application_name=”acid-minimal-cluster-0",client_addr=”172.17.0.17",server=”acid-minimal-cluster-1:5432",slot_name=”182",state=”streaming”} 0
pg_stat_replication_reply_time{application_name=”acid-minimal-cluster-0",client_addr=”172.17.0.17",server=”acid-minimal-cluster-1:5432",slot_name=”182",state=”streaming”} 1.663625745e+09
pg_static{server=”acid-minimal-cluster-1:5432",short_version=”13.7.0",version=”PostgreSQL 13.7 (Ubuntu 13.7–1.pgdg18.04+1) on x86_64-pc-linux-gnu, compiled by gcc (Ubuntu 7.5.0–3ubuntu1~18.04) 7.5.0, 64-bit”} 1
pg_up 1
pg_up == 1 - yay! It works!
Prometehus ServiceMonitors
Open the port to access Prometheus itself:
$ kubectl -n monitoring port-forward svc/kube-prometheus-stack-prometheus 9090:9090
Forwarding from 127.0.0.1:9090 -> 9090
Forwarding from [::1]:9090 -> 9090
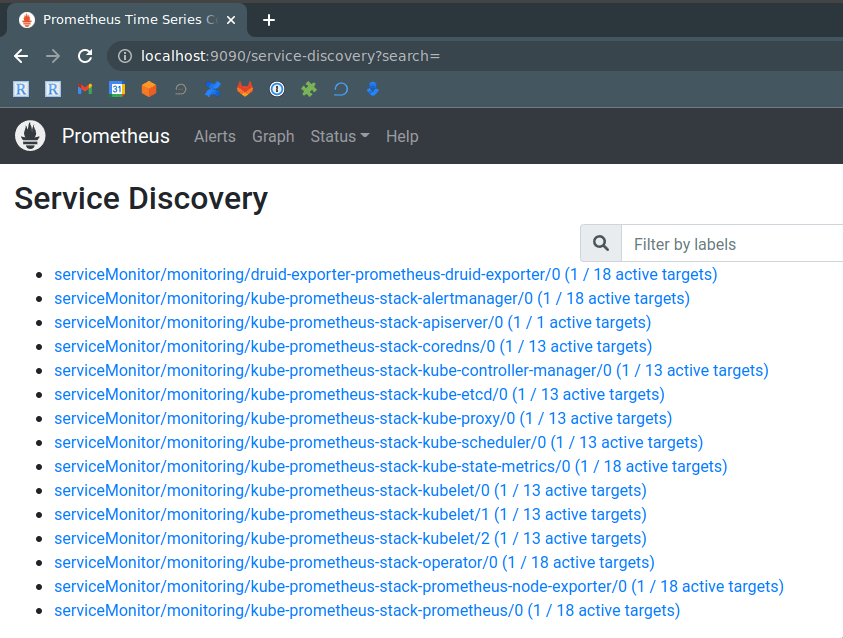
Check Status > Service Discovery — we don’t see PostgreSQL here:
ServiceMonitors are already created from the manifest:
$ kubectl -n test-pg get servicemonitor
NAME AGE
acid-minimal-cluster-svcm-master 65m
acid-minimal-cluster-svcm-replica 65m
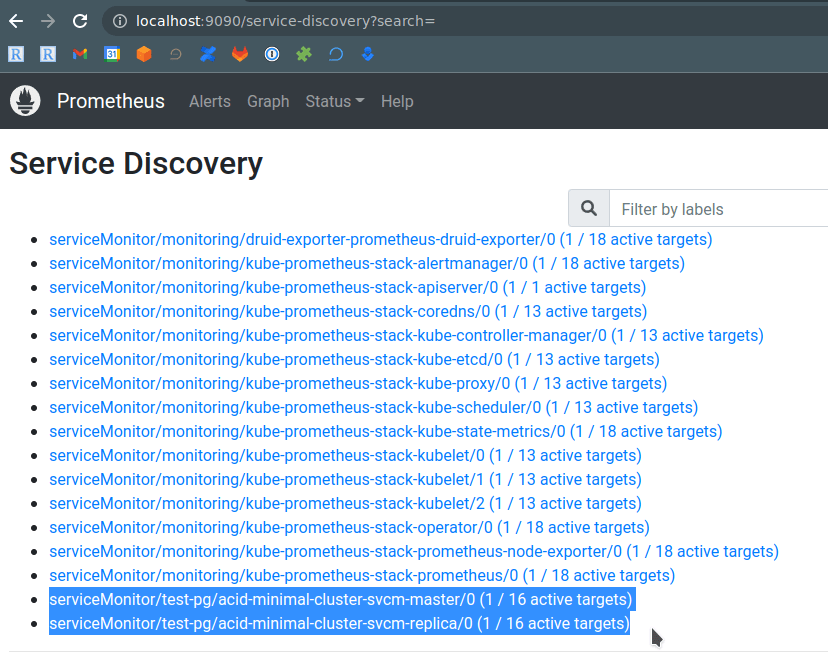
Let’s repeat the “dirty hack” as we did for Druid — add a label to them "release": "kube-prometheus-stack", wait a minute or two, and check again:
And we got our PostgreSQL’s cluster metrics in the Prometheus graphs:
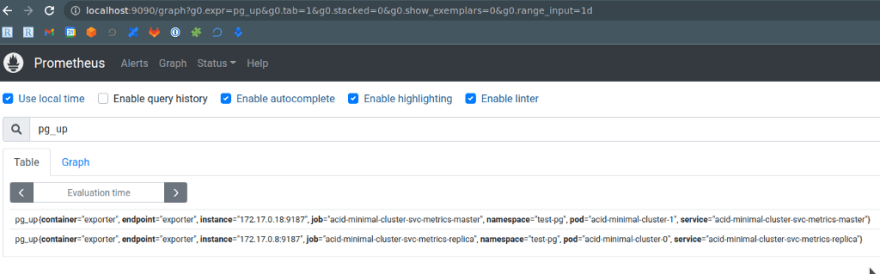
Done.
Originally published at RTFM: Linux, DevOps, and system administration.


Latest comments (0)