![]() The last time I configured Loki for logs collecting and monitoring was in February 2019 – almost a year ago, see the Grafana Labs: Loki – logs collecting and monitoring system post, when Loki was in its Beta state.
The last time I configured Loki for logs collecting and monitoring was in February 2019 – almost a year ago, see the Grafana Labs: Loki – logs collecting and monitoring system post, when Loki was in its Beta state.
Now we faced with outgoing traffic issues in our Production environments and can’t find who guilty for that.
One of the ways to try to catch it is to collect statistics about DNS requests and then to see if there is a correlation between the OUT spikes and DNS requests on AWS EC2 hosts to the local dnsmasq services.
The dnsmasq configuration is described in the dnsmasq: AWS – “Temporary failure in name resolution”, logs, debug and dnsmasq cache size post, and in this one we will try to realize the next:
-
dnsmasqwrites all requests to a local log-file - the log is tailed by the
promtailwhich sends data to a monitoring host with Loki - and finally, Grafana will draw graphs basing on the data from Loki
The setup described below is more Proof of Concept as the Loki itself and its support in Grafana still under development.
But now the Explore feature in Grafana supports aggregation and counting functions similarly to Prometheus – sum(), rate(), etc.
The promtail during the last year also added some new interesting abilities which will we use in this post.
At first, we will spin up a usual Grafana + Loki + promtail stack, then will add logs collecting from our Production environment and finally – will add a Grafana’s dashboard using new LogQL’s functions
Let’s go!
- Loki start
- Grafana start
- NGINX
- promtail start
- promtail and dnsmasq‘s logs
- LogQL – Loki’s logs aggregation and counters
- Loki “Internal Server Error”
- Prometheus as… Loki? О.О
- rate()
- promtail pipeline stages
- Grafana DNS dashboard
Loki start
Loki will start by Docker Compose, create a loki-stack.yml file:
version: '2.4'
networks:
  loki:
services:
  loki:
    image: grafana/loki:master-2739551
    ports:
      - "3100:3100"
    networks:
      - loki
    restart: unless-stopped
Run it:
root@monitoring-dev:/opt/loki# docker-compose -f loki-stack.yml up
Check:
root@monitoring-dev:/home/admin# curl localhost:3100/ready
Ready
Loki API documentation here>>>.
Grafana start
In the same way repeat with Grafana using the 6.4.4 version (see all available versions in its Docker Hub):
version: '2.4'
networks:
  loki:
services:
  loki:
    image: grafana/loki:master-2739551
    ports:
      - "3100:3100"
    networks:
      - loki
    restart: unless-stopped
  grafana:
    image: grafana/grafana:6.4.4
    ports:
      - "3000:3000"
    networks:
      - loki
    restart: unless-stopped
Start it, check it:

Log in with admin:admin, go to the Datasources:

As we have Loki running in a Docker network – use the http://loki URI here:

NGINX
The setup is performed on an existing Monitoring Dev environment, so I already have NGINX configured there.
The Loki’s config /etc/nginx/conf.d/dev.loki.example.com.conf look like next:
upstream grafana-loki {
    server 127.0.0.1:3000;
}
server {
    listen 80;
    server_name  dev.loki.example.com;
    # Lets Encrypt Webroot
    location ~ /.well-known {
    root /var/www/html;
        allow all;
    }

    location / {

        allow 194.***.***.26/29;
        allow 91.***.***.78/32;
        allow 188.***.***.94/32;
        allow 78.***.***.191/32;
        allow 176.***.***.43/32;
        allow 10.0.10.0/24;
        deny  all;
        return 301 https://dev.loki.example.com$request_uri;
    }
}
server {
    listen       443 ssl;
    server_name  dev.loki.example.com;
#    access_log  /var/log/nginx/dev.loki.example.com-access.log proxy;
    error_log /var/log/nginx/dev.loki.example.com-error.log warn;
#    auth_basic_user_file /var/www/dev.loki.example.com/.htpasswd;
#    auth_basic "Password-protected Area";
    allow 194.***.***.26/29;
    allow 91.***.***.78/32;
    allow 188.***.***.94/32;
    allow 78.***.***.191/32;
    allow 176.***.***.43/32;
    allow 10.0.10.0/24;
    deny  all;
    ssl_certificate /etc/letsencrypt/live/dev.loki.example.com/fullchain.pem;
    ssl_certificate_key /etc/letsencrypt/live/dev.loki.example.com/privkey.pem;
    ssl_protocols TLSv1 TLSv1.1 TLSv1.2;
    ssl_prefer_server_ciphers on;
    ssl_dhparam /etc/nginx/dhparams.pem;
    ssl_ciphers "EECDH+AESGCM:EDH+AESGCM:ECDHE-RSA-AES128-GCM-SHA256:AES256+EECDH:DHE-RSA-AES128-GCM-SHA256:AES256+EDH:ECDHE-RSA-AES256-GCM-SHA384:DHE-RSA-AES256-GCM-SHA384:ECDHE-RSA-AES256-SHA384:ECDHE-RSA-AES128-SHA256:ECDHE-RSA-AES256-SHA:ECDHE-RSA-AES128-SHA:DHE-RSA-AES256-SHA256:DHE-RSA-AES128-SHA256:DHE-RSA-AES256-SHA:DHE-RSA-AES128-SHA:ECDHE-RSA-DES-CBC3-SHA:EDH-RSA-DES-CBC3-SHA:AES256-GCM-SHA384:AES128-GCM-SHA256:AES256-SHA256:AES128-SHA256:AES256-SHA:AES128-SHA:DES-CBC3-SHA:HIGH:!aNULL:!eNULL:!EXPORT:!DES:!MD5:!PSK:!RC4";
    ssl_session_timeout 1d;
    ssl_stapling on;
    ssl_stapling_verify on;
    location / {
        proxy_redirect          off;
        proxy_set_header        Host            $host;
        proxy_set_header        X-Real-IP       $remote_addr;
        proxy_set_header        X-Forwarded-For $proxy_add_x_forwarded_for;
        proxy_pass http://grafana-loki$request_uri;
    }
}
promtail start
For now, there is nothing in the Grafana Explore as no logs are sent to the Loki yet.
Create promtail‘s config – /opt/loki/promtail.yml:
In the client block use URL as http://loki:
server:
  http_listen_port: 9080
  grpc_listen_port: 0
positions:
  filename: /tmp/positions.yaml
client:
  url: http://loki:3100/loki/api/v1/push
scrape_configs:
  - job_name: messages
    static_configs:
    - targets:
        - localhost
      labels:
        job: all-logs
        env: dev
        host: monitoring-dev
        __path__: /var/log/*.log
Add the promtail to the Compose file, mount the config in there and specify a command for the promtail to let it know which config file to use:
...
  promtail:
    image: grafana/promtail:master-2739551
    networks:
      - loki
    volumes:
      - /opt/loki/promtail.yml:/etc/promtail/promtail.yml
    command:
      - '-config.file=/etc/promtail/promtail.yml'
    restart: unless-stopped
Check it.
The promtail‘s output:
...
promtail_1  | level=info ts=2019-11-16T09:19:57.935528884Z caller=filetargetmanager.go:257 msg="Adding target" key="{env="dev", host="monitoring-dev", job="all-logs"}"
promtail_1  | ts=2019-11-16T09:19:57.936230518Z caller=log.go:124 component=tailer level=info msg="Seeked /var/log/dpkg.log - &{Offset:0 Whence:0}"
promtail_1  | level=info ts=2019-11-16T09:19:57.936292402Z caller=tailer.go:77 component=tailer msg="start tailing file" path=/var/log/dpkg.log
...
dpkg.log is tailed. okay.
And check in the Grafana Explore:

Nice!
promtail and dnsmasq‘s logs
Now, let’s go to our Production хост and check if you can access Loki from there:
root@bttrm-production-console:/home/admin# curl http://dev.logger.example.com:3100/ready
Ready
Create a promtail‘s config promtail-dev.yml there:
server:
  http_listen_port: 9080
  grpc_listen_port: 0
positions:
  filename: /tmp/positions.yaml
client:
  url: http://dev.loki.example.com:3100/loki/api/v1/push
scrape_configs:
  - job_name: dnsmasq
    static_configs:
    - targets:
        - localhost
      labels:
        job: dnsmasq
        env: production
        host: bttrm-prod-console
        __path__: /var/log/dnsmasq.log
Pay attention that Loki’s endpoints were changed since my last setup, now it is /loki/api/v1/push.
See the Loki’s API documentation here>>>.
For now – let’s run it without Docker Compose – I have full monitoring exporters stack there and will add Promtail to it later:
root@bttrm-production-console:/opt/prometheus-client# docker run -ti -v /opt/prometheus-client/promtail-dev.yml:/etc/promtail/promtail.yml grafana/promtail:master-2739551 -config.file=/etc/promtail/promtail.yml
Unable to find image 'grafana/promtail:master-2739551' locally
master-2739551: Pulling from grafana/promtail
...
Status: Downloaded newer image for grafana/promtail:master-2739551
level=warn ts=2019-11-16T09:29:00.668750217Z caller=filetargetmanager.go:98 msg="WARNING!!! entry_parser config is deprecated, please change to pipeline_stages"
level=info ts=2019-11-16T09:29:00.669077956Z caller=server.go:121 http=[::]:9080 grpc=[::]:45421 msg="server listening on addresses"
level=info ts=2019-11-16T09:29:00.66921034Z caller=main.go:65 msg="Starting Promtail" version="(version=, branch=, revision=)"
level=info ts=2019-11-16T09:29:05.669176878Z caller=filetargetmanager.go:257 msg="Adding target" key="{env="production", host="bttrm-prod-console", job="dnsmasq"}"
Er…
And why no logs are tailed? There is must be the “msg=”start tailing file” path=/var/log/dnsmasq.log” string…
And what happened with Loki?
What is the “_ Error connecting to datasource: Data source connected, but no labels received. Verify that Loki and Promtail is configured properly _” error?

Well, can try to re-create containers:
root@monitoring-dev:/opt/loki# docker rm loki_grafana_1 loki_promtail_1
loki_grafana_1
loki_promtail_1
Good – that helped, Loki went back now.
And logs weren’t collected because I forgot to mount the /var/log to the promtail‘s container – add the -v /var/log:/var/log in its run coomand:
root@bttrm-production-console:/home/admin# docker run -ti -v /opt/prometheus-client/promtail-dev.yml:/etc/promtail/promtail.yml -v /var/log:/var/log grafana/promtail:master-2739551 -config.file=/etc/promtail/promtail.yml
level=warn ts=2019-11-16T09:48:02.248719806Z caller=filetargetmanager.go:98 msg="WARNING!!! entry_parser config is deprecated, please change to pipeline_stages"
level=info ts=2019-11-16T09:48:02.249227598Z caller=server.go:121 http=[::]:9080 grpc=[::]:39883 msg="server listening on addresses"
level=info ts=2019-11-16T09:48:02.249381673Z caller=main.go:65 msg="Starting Promtail" version="(version=, branch=, revision=)"
level=info ts=2019-11-16T09:48:07.249262647Z caller=filetargetmanager.go:257 msg="Adding target" key="{env="production", host="bttrm-prod-console"}"
level=info ts=2019-11-16T09:48:07.24943453Z caller=tailer.go:77 component=tailer msg="start tailing file" path=/var/log/dnsmasq.log
ts=2019-11-16T09:48:07.249544341Z caller=log.go:124 component=tailer level=info msg="Seeked /var/log/dnsmasq.log - &{Offset:0 Whence:0}"
Got logs now:

LogQL – Loki’s logs aggregation and counters
Here is the most interesting part starting – LogQL and aggregation/counting functions.
However, I had to spend some time before made it works as Grafana’s and Loki’s documentation dis not clear about all the details.
Loki “Internal Server Error”
If try to execute a query like count_over_time({job="dnsmasq"}[5m]) – will see the Internal Server error:
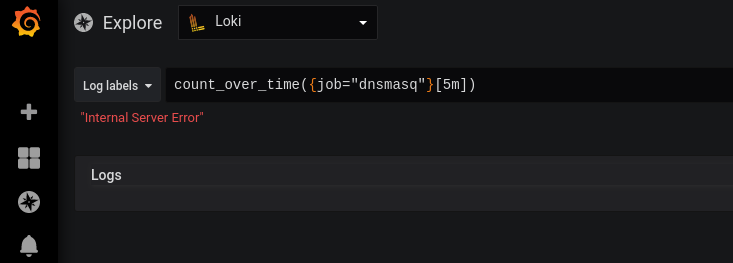
And it is caused by the… Spaces!
Fix it – add spaces between braces, but now Grafana just can’t find anything:
count_over_time( {job="dnsmasq"}[5m] )

Prometheus as… Loki? О.О
It was a bit weird, but it works)
Also, this is not documented anywhere but I found this “solution” in the grafana.slack.com community.
In Grafana 6.5 Loki must support functions in a normal way, but for now – let’s do something strange.
Go to the Datasources, and add Prometheus – but as Loki.
Or Loki – as a Prometheus?
Anyway, chose Prometheus type but in the URL specify the http://loki:310/loki – with /loki at the end:

And check:

Great!
rate()
Let’s try to call something like rate() + regex to chose hosts names from the dnsmasq‘s log:

“It works!”
By the way, Grafana displays functions and their descriptions when you’ll start typing it:

promtail pipeline stages
And one new (?) interesting thing in the promtail – can’t remember it was a year ago – the pipeline stages.
Documentation is here>>>.
In its original:
A pipeline is used to transform a single log line, its labels, and its timestamp. A pipeline is comprised of a set of stages. There are 4 types of stages:
- Parsing stages parse the current log line and extract data out of it. The extracted data is then available for use by other stages.
- Transform stages transform extracted data from previous stages.
- Action stages take extracted data from previous stages and do something with them. Actions can:
- Add or modify existing labels to the log line
- Change the timestamp of the log line
- Change the content of the log line
- Create a metric based on the extracted data
Filtering stages optionally apply a subset of stages or drop entries based on some condition.
So, in short terms – you can build a pipeline for data with multitype stages.
Stages can be:
- Parsing stages: will parse the log and extract data to pass it then to the next stages
- Transform stages: will transform data from a previous stage(s)
-
Action stages: receives data from the previous stage(s) and can:
- add/remove labels
- change timestamp
- change log’s line
- create a metric(s) basing on an extracted data
Typical pipelines will start with a parsing stage (such as a regex or json stage) to extract data from the log line. Then, a series of action stages will be present to do something with that extracted data. The most common action stage will be a labels stage to turn extracted data into a label.
Let’s go back to the very beginning of this whole story – what we want to achieve?
We want to get all IN A requests to our dnsmasq, extract hostnames and display a graph – how many requests were performed for a particular domain name.
Thus, we need to:
- grab all IN A requests
- save each to a label
- and count them
Go to the promtail on the Production and add stages – update the promtail-dev.yml config file:
server:
  http_listen_port: 9080
  grpc_listen_port: 0
positions:
  filename: /tmp/positions.yaml
client:
  url: http://dev.loki.example.com:3100/loki/api/v1/push
scrape_configs:
  - job_name: dnsmasq
    static_configs:
    - targets:
        - localhost
      labels:
        job: dnsmasq
        env: production
        host: bttrm-prod-console
        __path__: /var/log/dnsmasq.log
    pipeline_stages:
    - match:
        selector: '{job="dnsmasq"}'
        stages:
        - regex:
            expression: ".*query\\[A\\] (?P<query>.*\\s)"
        - labels:
            query:
In the pipeline_stages here we:
- chose the
dnsmasqjob - create a regex stage which selects all lines with the query[A] string
- create a regex group called query, where will save resulted string till the first space i.e. a string origin could be: Nov 16 08:23:33 dnsmasq[17597]: query[A] backend-db3-master.example.com from 127.0.0.1 and in the query regex group will get the value: backend-db3-master.example.com
- create a
labelsstage which will attach a new label called query with the backend-db3-master.example.com value taken from the query regex group
Run promtail:
root@bttrm-production-console:/home/admin# docker run -ti -v /opt/prometheus-client/promtail-dev.yml:/etc/promtail/promtail.yml -v /var/log:/var/log grafana/promtail:master-2739551 -config.file=/etc/promtail/promtail.yml

level=info ts=2019-11-16T11:56:29.760425279Z caller=server.go:121 http=[::]:9080 grpc=[::]:32945 msg="server listening on addresses"

level=info ts=2019-11-16T11:56:29.760565845Z caller=main.go:65 msg="Starting Promtail" version="(version=, branch=, revision=)"

level=info ts=2019-11-16T11:56:34.760567558Z caller=filetargetmanager.go:257 msg="Adding target" key="{env="production", host="bttrm-prod-console", job="dnsmasq"}"

level=info ts=2019-11-16T11:56:34.760752715Z caller=tailer.go:77 component=tailer msg="start tailing file" path=/var/log/dnsmasq.log

ts=2019-11-16T11:56:34.760863031Z caller=log.go:124 component=tailer level=info msg="Seeked /var/log/dnsmasq.log - &{Offset:0 Whence:0}"
Check the Grafana’s graph:

And create a query like:
sum (rate( ( {env="production",query=~".*\\..*"} )[5m] )) by (query)
In the query=~".*\\..*" I had to create a “crunch” to get rid of data without the query label, but I guess it must be a more correct way to do it. For now – I can leave this thing.
Let’s see the result:

Awesome!
Well…
And the hostnames there is the from string…
Why?
Use the https://regex101.com, fix the regex, the result is:
.*query\[A\] (?P<query>[^\s]+)
Update promtail‘s config:
...
    pipeline_stages:
    - match:
        selector: '{job="dnsmasq"}'
        stages:
        - regex:
            expression: ".*query\\[A\\] (?P<query>[^\\s]+)"
        - labels:
            query:
Grafana DNS dashboard
Okay, in general – we saw it will work. Now, let’s try to create a dashboard that will put all together in a nice graph with all DNS requests statistics.
Click on the Add query:

Add our query:
sum (rate( ( {env="production", query=~".*\\..*"} )[5m] )) by (query)
In the Legend use substitution query to display the value only:

Okay, not bad…
Let’s add some variables to make it possible to chose queries.
Go to the Dashboard Settings > Variables > Add variable, and…
Template variables still not supported for Loki :-(
Or I just didn’t found the correct way to execute the label_values() for Loki…
Documentation is here>>>.
Want to create a variable with values from the query label to be able to select a particular domain name, but – alas…
Okay, for now, can do just a simple filter – create a variable with the Text box type:

And to select an environment – create a Custom type variable:

Go back to the query, update it to use those variables:
sum (rate( ( {env="$env", query=~"$include"} )[5m] )) by (query)

And test it with a filter by a domain:

And the result is the Grafana dashboard with statistics by hostname DNS requests:

Useful links
- Grafana Explore
- Using Loki in Grafana
- LogQL: Log Query Language
- Labels from Logs
- Loki’s HTTP API
- Configuring Promtail
- Promtail Pipelines
- Regular Expression Reference: Named Groups and Backreferences
- Grafana Labs: Loki – distributed system, labels and filters
- Grafana Labs: Loki – using AWS S3 as a data storage and AWS DynamoDB for indexes
- Prometheus: RTFM blog monitoring set up with Ansible – Grafana, Loki, and promtail


Top comments (0)