AWS: Cost Explorer - costs checking on the CloudWatch Logs example

This post isn’t an overview of the AWS Cost Explorer service, but just a quick example of how to detect costs for your AWS account and its services.
So, when I came back from the vacation, I noticed that we’ve paid more than usually for the AWS CloudWatch for August — almost 50 dollars per day (included to the Others on the graph below):

To find out, what exactly in CloudWatch spends our money, in the Filters choose the CloudWatch, and in the Group by use the Usage type:

And we can see, that DataProcessing-Bytes increased a lot during August, and this is the first point to the CloudWatch Logs.
Let’s check if it is so — switch Group by to the API Operation:

Wow! Now we can see, that from the 50 dollars per day we are paying 40 only to write new events to the CloudWatch Logs! The API operation name PutLogEvents speaks for itself.
Okay, now we need to find out which Log Group generates most of all from the traffic.
Go to the CloudWatch Metrics, choose Logs — Log Groups Metrics:

Here, select all the IncomingBytes, and you'll see activity per all your Log Groups:

At the top, we have an Aurora cluster that has general log enabled for the monitoring, a one EKS cluster, our Dev environment, where we have a lot of activities, and a cloudtrail-bttrm-management-events Log Group, where we have our CloudTrail activities, see AWS: CloudTrail overview and integration with CloudWatch and Opsgenie.
So, the final thing is to tune those services’ logging settings.
For the CloudTrail we can disable logging about Write operations, as we didn’t use them for alerting, and exclude some AWS KMS and AWS RDS logging:

And for the EKS cluster — disable all or a set of logs:
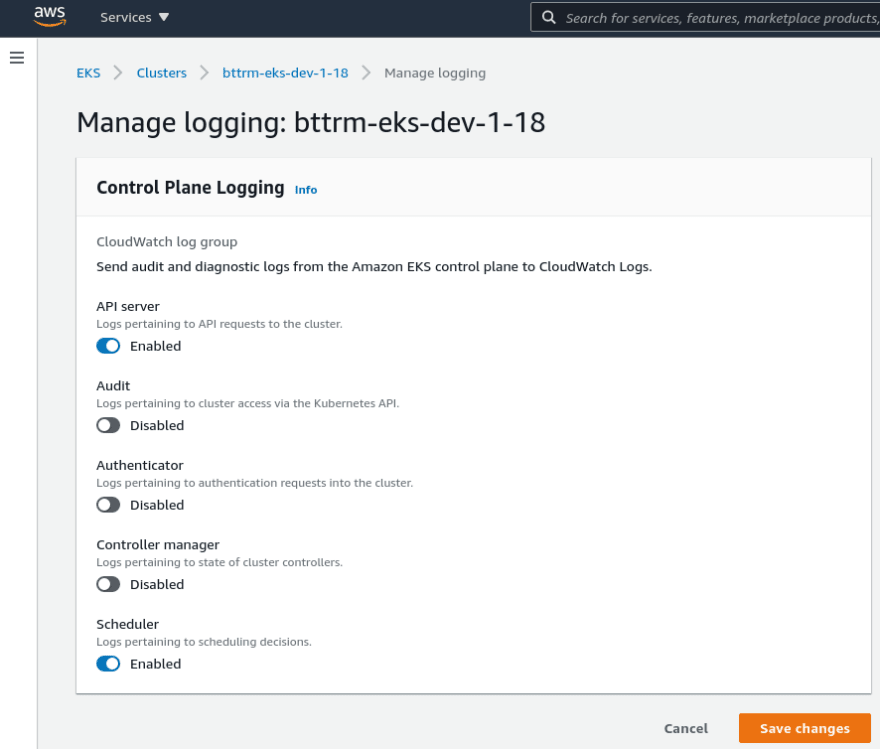
Done.
Originally published at RTFM: Linux, DevOps, and system administration.


Latest comments (0)