Understanding and visualising is critical to better understand your app's structure and more importantly - package vulnerabilities.
This is why we've created Sinkchart - beautiful Visualizations For Your App's Dependencies
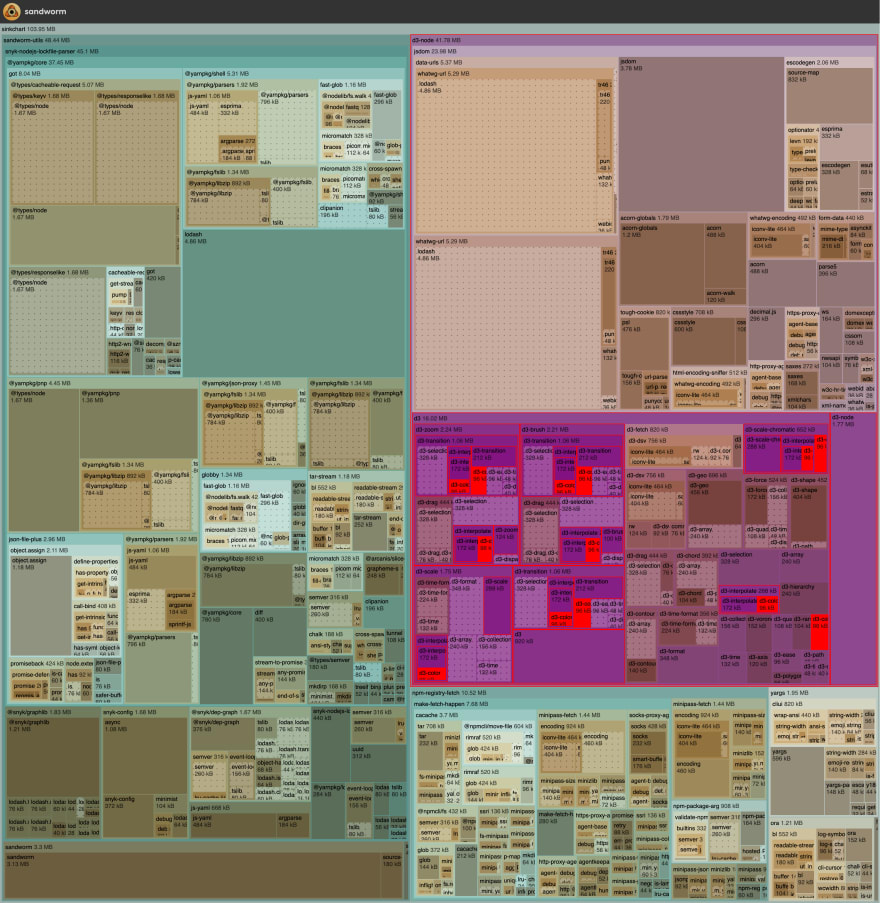
Sinkchart offers two types of visualisations: Treemap and Tree
*Treemap: *
- Node colors represent the dependency depth;
- Node surface represents the size of the corresponding directory under node_modules;
- A dotted pattern in a node background means the package is a shared dependency, required by multiple packages, and present multiple times in the chart;
- Shared dependency sizes are added to every dependent package, to represent the independent size structure properly; hence, the displayed size might be larger than the actual size on disk;
- A red package background means the package has direct vulnerabilities;
- A purple package background means the package depends on other vulnerable packages;
- Click on a node to make the tooltip persist; click outside to close it;
When representing deep dependencies, the surface area of certain packages might reach zero, making them invisible.
Tree:
Nodes are grouped by color based on the root dependency that they belong to;
Red text in a package name means the package has direct vulnerabilities;
Purple text in a package name means the package depends on other vulnerable packages;
Click on a node to make the tooltip persist; click outside to close it;
By default, the tree chart has a maximum depth of 7, meaning only seven levels of dependencies will be represented, to keep the output readable; you can override this using the --md option.

Here are some samples of very popular packages:
- Apollo Client 3.7.1
- Nest.js 9.1.2
You can check out your own's app Tree structure and Treemap visualisation - install Sinkchart now: yarn global add sinkchart # or npm install -g sinkchart


Oldest comments (0)