Introduction
As we move towards a Cloud Native world, where loads are ephemeral, horizontal scaling is key and microservices are the norm, monitoring all of these spread out components becomes not only essential, but mandatory on any production-ready environment.
This post is part of a series named Cloud Native Monitoring at Scale which focuses on all stages of monitoring across a cloud-native application deployed on Kubernetes. Since from a single running application to understand if it is up and running as expected (check my previous post) all the way to having multiple k8s clusters running multiple applications simultaneously.
This post aims to understand why exposing metrics of our applications is so important and why they are relevant to our ability to monitor systems at scale.
What are metrics?
I believe that Digital Ocean's page on Metrics, Monitoring and Alerting gives a very well-written explanation about these concepts:
Metrics, monitoring, and alerting are all interrelated concepts that together form the basis of a monitoring system. They have the ability to provide visibility into the health of your systems, help you understand trends in usage or behavior, and to understand the impact of changes you make. If the metrics fall outside of your expected ranges, these systems can send notifications to prompt an operator to take a look, and can then assist in surfacing information to help identify the possible causes.
These metrics can be sourced from multiple levels of abstraction on which our application run on top. Some examples are:
- Host-based (Bare metal, VM, Container): CPU usage, Memory usage, Disk space, etc.
- Container Orchestration (e.g. Kubernetes): Pod restart count, CPU Throttling, Container health status (as shown on my previous post), etc.
- Application: most common metrics methodology for monitoring applications are the RED (request rate, errors, duration), USE (usage, saturation, errors) or Golden signal metrics (latency, traffic, errors, saturation);
Why are metrics important?
Metrics are a way into understanding better the behavior and symptoms of our systems which enable us to act on them, possibly preventing worsen scenarios such as service degradation or even downtime.
A good way to look at metrics is by doing an analogy with a very well known complex system that we interact with every single day: The human body.
Our own bodies expose metrics all the time such as:
- Body temperature
- O2 saturation
- Heartbeat rate
- etc.

These metrics enable us (or doctors) to have a deeper understanding about the overall status of our (body) systems and identify certain thresholds on which abnormal behavior can trigger an alert/concern.
For example, if our Body Temperature is above 38ºC (100.4ºF) we identify this symptom has having a fever which can have multiple root causes behind it (infectious disease, immunological diseases, metabolic disorders, etc.) but it helps us understand that something within our overall system is not within the "normal" threshold and should be investigated further.
Our applications are no different, exposing metrics about our applications such as response latency, error rate, number of cache miss events, etc. allows us to monitor these metrics and understand whenever an abnormal behavior is present and start investigating what the root cause might be.
Exposing metrics
In order for us to take full advantage of these capabilities we need to expose metrics about all components to which can affect the overall health of our application.
Scenario
Let's picture a scenario where we have a Golang application that reads from a queue and sends emails, this application is running within a container on top of an orchestrator like Kubernetes that is running in our on-prem bare-metal machines.
In this scenario we can clearly split the three levels of abstraction:
- Bare metal machine (Host layer)
- Kubernetes (Orchestration layer)
- Our Application (Application layer)
As we want to have as much information as possible regarding all layers that could affect our application, we would need to expose metrics of each of these layers.
Host layer
In order to collect metrics about our host layer, such as CPU usage, Disk usage / availability, network traffic, etc. we can take advantage of open-source metrics exporters that not only expose these metrics, but also enable them to be collected by the most common used tools in the market (e.g. Prometheus / PromQL).
All metrics mentioned above can be exposed by having Node Exporter running within your host layer, which will make your host expose its metrics at a specific port (default: 9100), for example:
# HELP go_gc_duration_seconds A summary of the GC invocation durations.
# TYPE go_gc_duration_seconds summary
go_gc_duration_seconds{quantile="0"} 3.8996e-05
go_gc_duration_seconds{quantile="0.25"} 4.5926e-05
go_gc_duration_seconds{quantile="0.5"} 5.846e-05
# etc.
These metrics can then be collected by an external system as shown on the metrics collection section.
Orchestration layer
When using an orchestration layer to manage the deployment such as Kubernetes, it eases our operational efforts of having to orchestrate all of our loads, but it also adds some complexity on top, which means another layer that could lead to operational issues if not monitored properly.
An orchestration layer can provide metrics such as:
- Deployment/Pod status (Running, Pending, Error, etc.)
- Container resource usage (CPU, Memory, etc.)
In the case of Kubernetes, it can expose metrics about some of its resources, such as: DaemonSet, Job, Deployment, CronJob, PersistentVolume, StorageClass, ResourceQuota, Namespaces, Pod, VerticalPodAutoscaler, etc.
These metrics can be exposed by using tools such as kube-state-metrics which also make these metrics available for collection.
Application layer
As this layer is the one that varies the most and is can be tailor-made to whatever business value your application aims to bring, on most cases it requires us to do an exploration of what key metrics are valuable about our application use-case that will matter the most when we want to understand its behavior and automate its monitoring.
In our scenario, our application which focuses on reading messages from a certain queue, then based on some business logic sends an email with a certain template.
It might be useful to expose some metrics about the usage and overall health of our application's ability to fulfill its added business value, for example:
email_messages_processed{template="sales_approved"} 532
email_messages_processed{template="sales_rejected"} 21
email_messages_read{source="finance_queue"} 68
email_messages_read{source="human_resources_queue"} 11
email_messages_read{source="management_queue"} 14
email_messages_failed{reason="unknown"} 7
email_messages_failed{reason="timeout"} 2
It can be achieved by implementing instrumentation within our codebase and have these metrics exposed under an endpoint (e.g. /metrics), in order to understand a bit better on how to achieve this, feel free to go through Prometheu's guide by using any of theirs client implementation for Golang, Python, Ruby and Java.
By implementing and exposing these metrics it enables our monitoring stack to not only track the health of our underlining systems, but also metrics related to our specific business logic and identify specific issues related to our codebase.
Metrics collection and analysis
Once we managed to have the metrics of all these different layers being exposed, we need to collect and store them in a way that would enable us to query and analyze their value over time. Prometheus, being the second hosted project at CNCF, right after Kubernetes, makes it the cloud-native industry standard for metrics collection, monitoring and alerting. This stack can be composed by the following components:
- Prometheus (Metrics Collection and Monitoring)
- Alertmanager (Alerts management)
- Grafana (Metrics Visualisation)
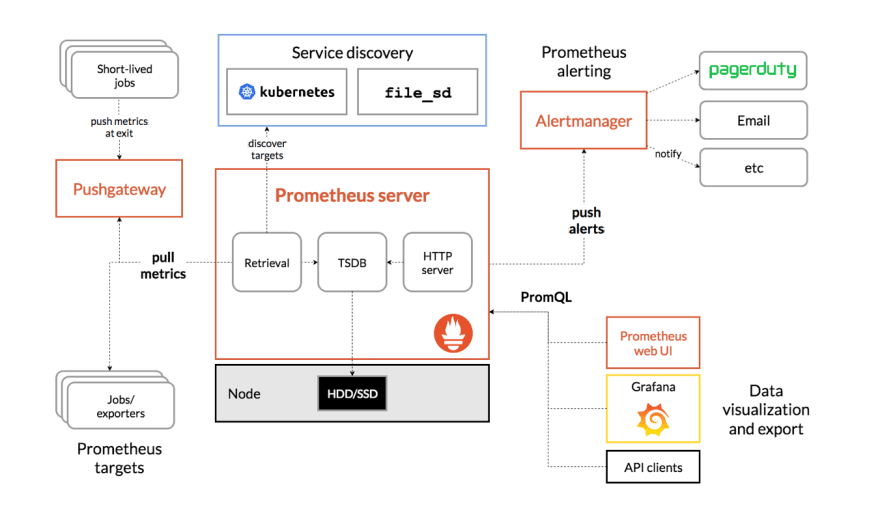
Metrics collection and monitoring
Prometheus main responsibility is to scrape target endpoints to collect metrics across multiple systems, through:
- Pre-defined HTTP endpoints (e.g. https://example.com/metrics);
- Service Discovery (e.g. Kubernetes Prometheus Operator ServiceMonitor)
Upon the collection of these metrics, Prometheus enables the usage of its own query language PromQL to analyze these metrics and get more information about all of our systems, e.g.:
http_requests_total{app={"email_processor"}}[5m]
or check if there's any container in a non-ready status within our Kubernetes cluster:
kube_pod_container_status_ready == 0
By leveraging our ability to query the metrics of all our systems, including our own application metrics, it allows the creation of the so-called alert expressions which when it returns results it triggers an alert, for example:
alert: EmailProcessTimeout
expr: rate(email_messages_failed{reason="timeout"}[5m]) > 0.5
for: 5m
labels:
  severity: warning
annotations:
  message: Suddently multiple email message processing have failed with reason Timeout over the last 5 minutes.
If there's a sudden change of emails failing due to timeout over the last 5 minutes, then it would trigger this alert and it would send it to an Alertmanager to be routed accordingly.
Alert management
As mentioned earlier, another core component of the Prometheus stack is the Alertmanager which its core focus is to handle alerts sent by client applications such as Prometheus.
Alertmanager not only handles the routing of these alerts to external vendors such as PagerDuty, OpsGenie, Slack, Email, etc. but it also handles:
- Deduplication
- Grouping
- Silencing and inhibition
- High Availability (deployed as a cluster)
Which are highly useful core functionalities to prevent alert fatigue and better handle alerts across an environment.
Alertmanager also allows to route alerts based on predefined labels, such as the severity: warning defined in the alert example exposed above.
Conclusion
The exposure, collection and analysis of metrics of all layers that have an impact in our infrastructure, orchestration and application which at the end of the day could hinder our capability of generating business value is not only important but essential to enable the early detection of issues within our engineering solutions.
Leveraging these tools to increase our observability across our entire stack, not only empowers an SRE team to more easily do its job, but also the ability to analyze metrics and its impact on the overall health of the system.
If you feel like discussing more about how monitoring not only your infrastructure, but also all layers that can impact your business are crucial to your organization, then reach out to me on Twitter.


Top comments (0)