Hello! Long time no see...
I've been busy with work and hacking away at certain small projects. One of which is a Grafana dashboard which I've been building on a Raspberry Pi Zero 2W my partner got me for Christmas (totally not because I asked for it...).
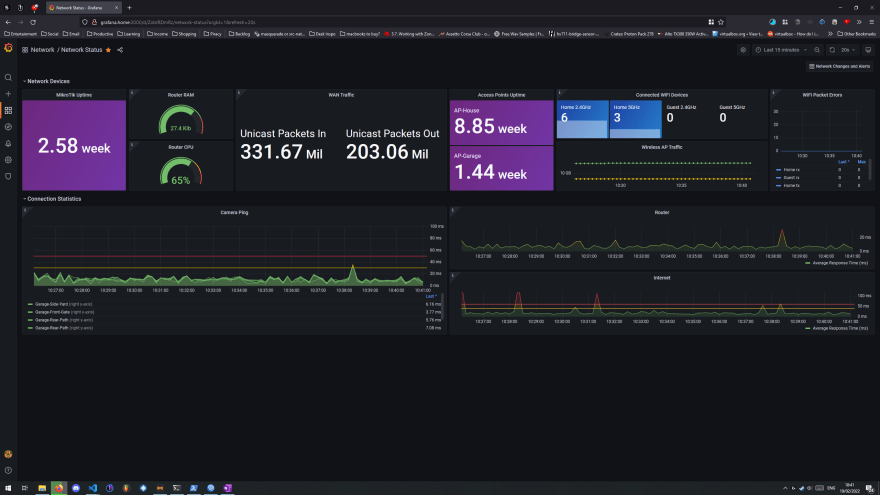
Above is my Grafana dashboard, and below is how it all came together.
Uptime
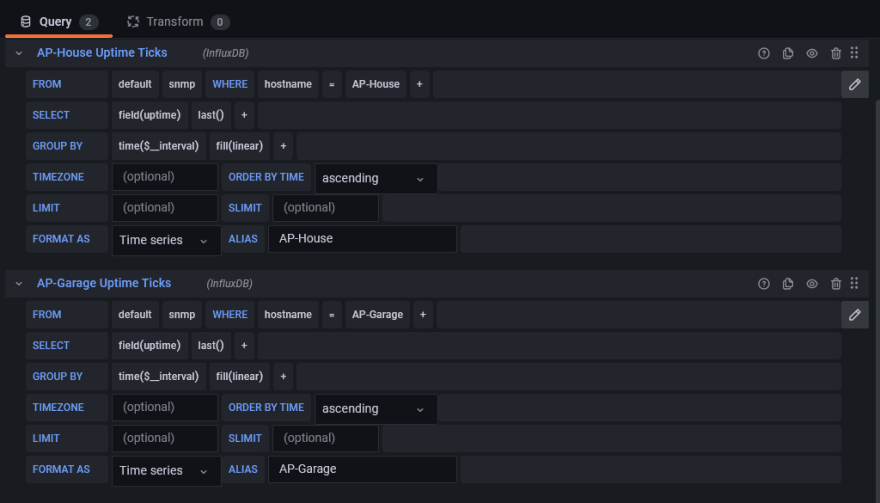
The first block is my MikroTik router uptime. And further to the right, I've also got uptime values for both of my Access Points.
This uptime is displayed in weeks - unfortunately Grafana doesn't have the option to do weeks and days - it's one or the other.
SNMP
An SNMP request to my router and APs gets the system uptime value:
[[inputs.snmp]]
  agents = [
    "192.168.0.1:161",
    "192.168.109.20:161",
    "192.168.109.21:161"
  ]
  interval = "20s"
  version = 2
  community = "public"

  [[inputs.snmp.field]]
    name = "hostname"
    oid = "SNMPv2-MIB::sysName.0"
    is_tag = true

  [[inputs.snmp.field]]
    name = "uptime"
    oid = "DISMAN-EVENT-MIB::sysUpTimeInstance"
Grafana Panel
Then, in Grafana, I simply display this. For the APs panel, I've got two queries running - one for each AP. I then simply display them horizontally.
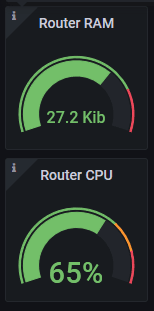
System Statistics
Beside the uptime, I've got my router CPU and RAM (both % of the max values):
SNMP
For both these values, the inputs are fairly similar.
CPU:
  [[inputs.snmp.field]]
    name = "uptime"
    oid = "DISMAN-EVENT-MIB::sysUpTimeInstance"

  [[inputs.snmp.field]]
    name = "cpu0-load"
    oid = "HOST-RESOURCES-MIB::hrProcessorLoad.1"

  [[inputs.snmp.field]]
    name = "cpu1-load"
    oid = "HOST-RESOURCES-MIB::hrProcessorLoad.2"

  [[inputs.snmp.field]]
    name = "cpu2-load"
    oid = "HOST-RESOURCES-MIB::hrProcessorLoad.3"

  [[inputs.snmp.field]]
    name = "cpu3-load"
    oid = "HOST-RESOURCES-MIB::hrProcessorLoad.4"
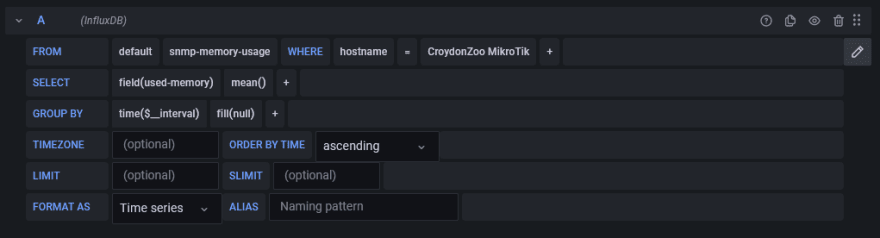
And RAM (this also includes storage, which I'm not using yet):
  [[inputs.snmp.table]]
    name = "snmp-memory-usage"
    inherit_tags = ["hostname"]
    [[inputs.snmp.table.field]]
      name = "memory-name"
      oid = ".1.3.6.1.2.1.25.2.3.1.3"
      is_tag = true
    [[inputs.snmp.table.field]]
      name = "total-memory"
      oid = ".1.3.6.1.2.1.25.2.3.1.5"
    [[inputs.snmp.table.field]]
      name = "used-memory"
      oid = ".1.3.6.1.2.1.25.2.3.1.6"
Grafana
Then they're just pulled into Grafana:
WiFi Status
I won't bore you with the non-functional "Wireless AP Traffic" panel, as that seems to reset itself constantly (I assume it's reaching a max value and therefore can't keep all the data).
Connected WiFi Devices
This one was easy... once I found the Ruckus MIBs, which were really hard to find (for your reference, I've uploaded them to GitHub).
The stats tables you need are these (both BSSID and SSID, to separate 2.4GHz and 5GHz if your SSIDs are the same for both frequencies):
[[inputs.snmp.table]]
    name = "wlanStats"
    inherit_tags = [ "hostname" ]
    oid = "RUCKUS-WLAN-MIB::ruckusWLANStatsTable"

      [[inputs.snmp.table.field]]
        name = "ruckusWLANStatsSSID"
        oid = "RUCKUS-WLAN-MIB::ruckusWLANStatsSSID"
        is_tag = true

      [[inputs.snmp.table.field]]
        name = "ruckusWLANStatsBSSID"
        oid = "RUCKUS-WLAN-MIB::ruckusWLANStatsBSSID"
Then, in Grafana, you can select the ruckusWLANStatsNumAuthSta value:

I did this for all 4 of my SSIDs (this was a bit of trial and error as the BSSID values are different for 2.4GHz and 5GHz).
Then I just displayed them as Stats and set up some fun colours.
Pings
I've also set up pings to all my IP cameras, 1.1.1.1 (the DNS server), and my router, to monitor for any network issues:
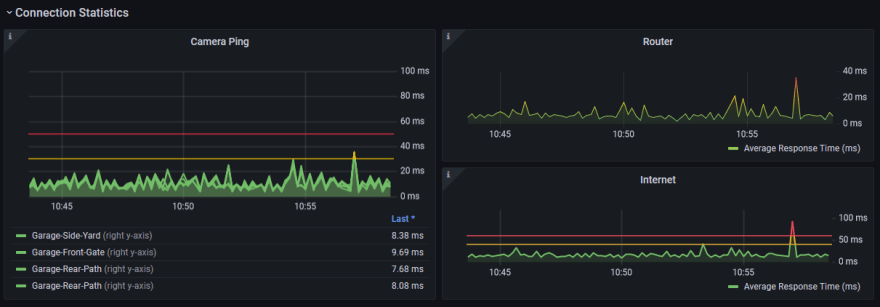
These were quite trivial to configure. Simply using the inputs.ping input in Telegraf got me the values, and then I pulled them into Grafana like this:
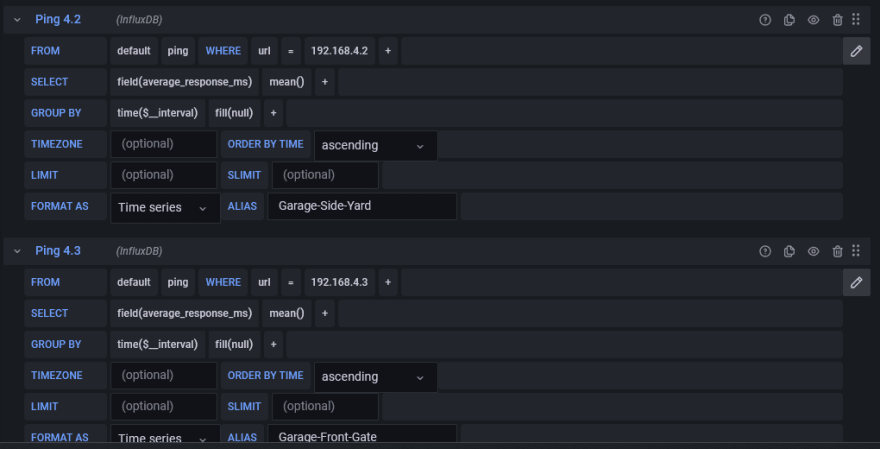
There's one for each camera.
Conclusion
There's not much else to say, really. If you have any questions or you fancy a chat, your best bet is probably cryptic messaging via GitHub. But if you're not into that, message me on Twitter and I might respond one day.


Top comments (0)