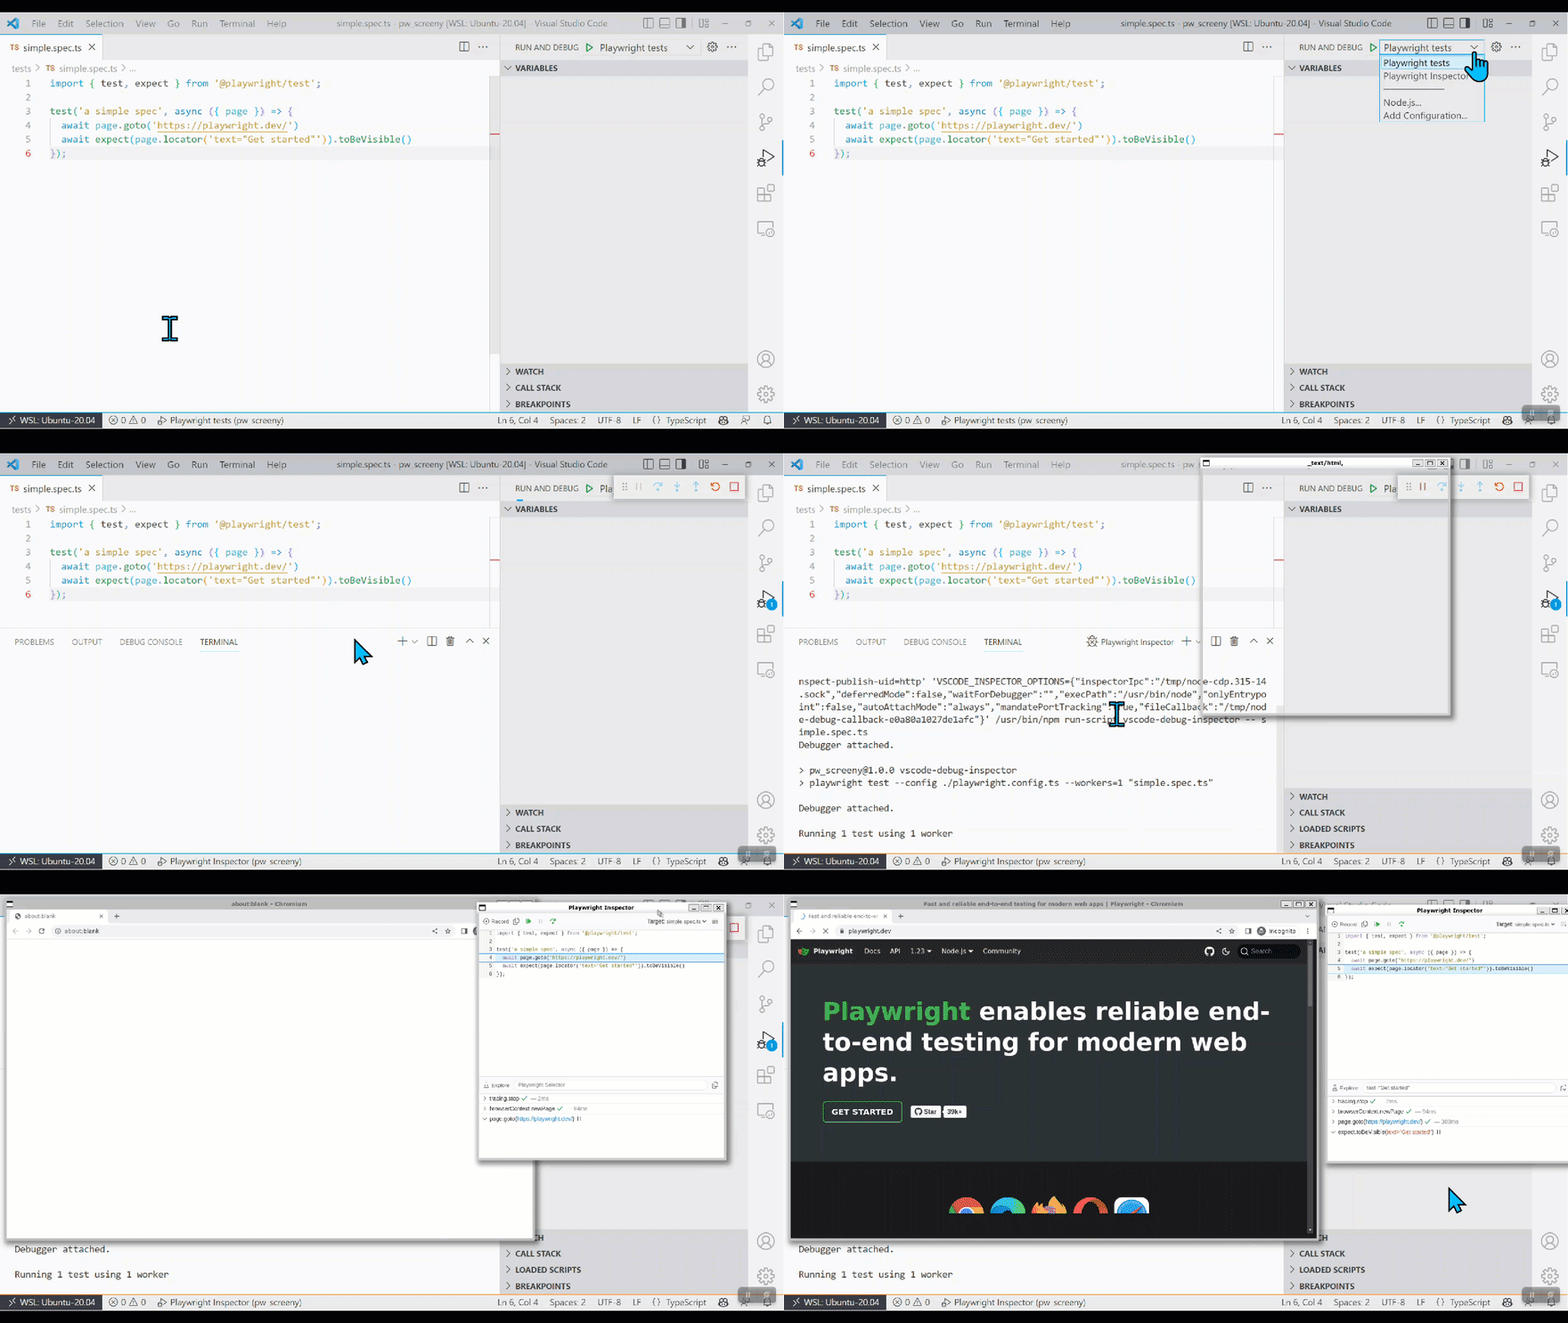
In this article we will look at an alternative approach to the Playwright VSCode extension by configuring our own VSCode launch config file. This will allow us to have finer control over specific launch configurations settings for our tests.
To begin with, create a new script in your package.json file called vscode-debug. (You might need to tweak the name of the playwright config file to suite your needs.)
"scripts": {
  "vscode-debug": "playwright test --config ./playwright.config.ts --workers=1"
},
Next, create a .vscode folder at the root of your project. In this folder, create a new json file named launch.json.
Input the following placeholder configuration details into the file
{
  "version": "0.2.0",
  "configurations": [
    {
      "type": "node",
      "request": "launch",
      "name": "Playwright tests",
      "console": "integratedTerminal",
      "skipFiles": [
        "<node_internals>/**"
      ],

    }
  ]
}
If you try and run the profile via clicking the play button below (or pressing F5), you will notice that it will do nothing.
Let us make configuration usable by adding the following entries:
"runtimeExecutable": "npm",
"runtimeArgs": ["run-script", "vscode-debug", "--", "${fileBasename}"],
Setting the runtimeExecutable to npm will allow you to invoke the npm script (vscode-debug) you created above. The --, "${fileBasename}" arguments will tell the launcher to pass the current highlighted file you have opened in your editor.
We can now test our settings by opening a spec file into your editor and clicking the run button:
To debug, simply place a breakpoint next to the line of code you desire and click the play button:
If you were to highlight and set focus onto a file that is not a spec file, running the profile should result in the following:
Ok so far so good, what if we wanted to launch into the Playwright inspector? This can be achieved by simply duplicating the profile created above and tweaking it slightly by changing the name to Playwright Inspector and we introduce a new key env which sets the PWDDEBUG environment variable to 1:
{
  "type": "node",
  "request": "launch",
  "name": "Playwright Inspector",
  "console": "integratedTerminal",
  "skipFiles": [
    "<node_internals>/**"
  ],
  "runtimeExecutable": "npm",
  "runtimeArgs": ["run-script", "vscode-debug", "--", "${fileBasename}"],
  "env": {
    "PWDEBUG": "1",
  }
}
Test your new profile by selecting "Playwright Inspector" and clicking the play button.
Pretty easy. You can get creative with these profiles to suit your needs. Other use cases could include:
- Setting up profile to launch your tests to execute on various test environments
- Create a launch profile to execute a test against a specific browser.
The possibilities are endless 🤯


Latest comments (0)