

Inspired by @codechips ' SQL Squid Game guide, I thought it would be fun to use some Squid Game data to write a guide on the basics of the Pandas library in Python including creating a DataFrame, modifying rows and columns and inspecting the data.
Importing Pandas
The first step is to import that Pandas library and alias it as pd. This means we don't have to call the full word when we run a Pandas function, we just need to type pd.
import pandas as pd
The main data structure of Pandas is a DataFrame, which is similar to an excel spreadsheet, where we can store data. Once the data is within a DataFrame, there are several ways it can be used, for example data analysis or to visualise it.
Introducing DataFrames
DataFrames store data in rows and columns. Each column has a name, which is a string, and each row has an index, which is typically an integer. Like lists in Python, DataFrames also use 0 indexing, which means the first row in index 0 instead of index 1. However, you can set the index to include extra information about what the row contains if you want.

DataFrames can contain many different data types, including strings, integers and floats.
You can create a DataFrame by uploading data from a csv file, but you can also create a DataFrame by typing values into a list and using a dictionary to transform it into a DataFrame. You can use multiple different lists, containing different data types, but the value of content included in each must be the same.
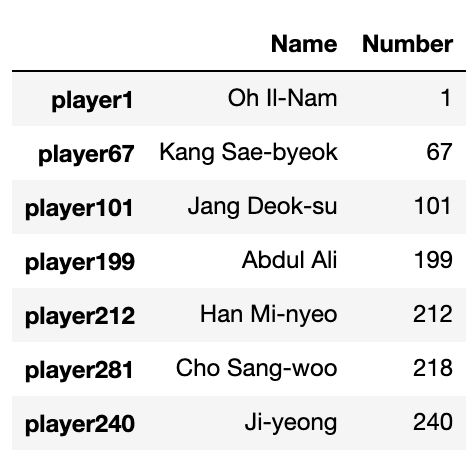
data = {'Name':  ['Oh Il-Nam', 'Kang Sae-byeok', 'Jang Deok-su', 'Abdul Ali', 'Han Mi-nyeo',  'Cho Sang-woo', 'Ji-yeong'],
'Number': [1, 67, 101, 199, 212, 218, 240],
        }

df = pd.DataFrame(data, index = ["player1", "player67", "player101", "player199", "player212", "player281",
"player240"])
As you can see above we have one list with the players names, typed as strings, and another with their number, which is an integer.
We then transform this dictionary of lists to a DataFrame using the pd.DataFrame() command. We also set the index values, by passing the string names as a list argument.
Inspecting a DataFrame
Once the data has been added, we want to make sure it looks correct and contains everything we want. The best method to do this is to use df.head(). This will show the first 5 rows of data. However, if you would like to see more data, i.e 10 rows, you can pass this as an argument within the brackets.
df.head(10)
If we want to only view the data from one row, we can use the panda-specific access method .loc. This is a label based method, meaning we have to specify the name of the row we want to view, this method can only use string. Here we add in the index name that we specified when creating the DataFrame.
print(df.loc["player67"])

The other access method is .iloc, which is integer based, by specifying the positional index of the row we want to view. We would use this one if we hadn't changed the index, or if we had changed it to another integer value instead of a string.

We can also get a count of how many rows within the DataFrame, by using the count() function. This will print the number of rows in each column.
df.count()

If we only want to print a single number to display the row count, we can pass in the name of the column we want to square within square brackets before the count function. Storing this within a variable will also enable us to use this number for functions in the future.
player_count = df['Name'].count()
player_count
Adding a new row
There are a couple of different ways to add new rows to a DataFrame. If we have multiple rows within another DataFrame, we can use the .append() function to add several rows to the end of our existing DataFrame.
However, if we have just 1 row to add, i.e only 1 new player to add, we can again use the .loc method to add the row to the end of our original DataFrame. As we are defining the name of our indexes, we need to pass this in before the new values that will be within the row. The number of values contained must match the number of columns we have and be in the correct order.
df.loc['player456'] = ['Seong Gi-hun', 456]
Now if we print the head() of the new DataFrame, we will see our new row added in 🧑🦰

Adding a new column
In addition to adding a new row, we can also add a new column. There are several ways you can define the value that will be contained within this column for each row, including based on what is within other columns and using conditional statement or lambda function. However, in this case we want the value to be the same for every row, to show that every player is currently playing the game.
For this we just need to add the name of our new column and assign it the value that we want to add.
df['Status'] = "Playing"

Changing values
Now we have a column with the status of all players that are playing the game. But what happens when we start to have eliminations? We need to update the value in that column 😬
Again, we will use the *.loc * method to define the row that we will be amending and the column that we will be changing the value of.
In this case it will be based on their number, so we need to pass in this column name and use the equals to ensure it is only going to change the single row that equals that row in the Number column. Next we will pass in the name of the column that we will be amending before assigning the new value of Eliminated 😢
df.loc[df.Number == 1, "Status"] = "Eliminated"

Deleting a row
Once players start being eliminated, they will be removed from the game, therefore we will want to ensure we have updated DataFrame that reflects this and only contains those who are currently playing.
Because we want to keep track of all of the players in the original DataFrame, we don't want to delete anything from this one. However, we can use the data from our original DataFrame to make another one while leaving the original untouched. We can do this by defining the name of our new DataFrame and apply some logic to pull data from our original one.
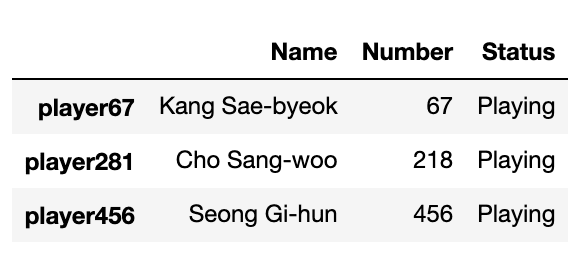
In this case, .drop() allows us to drop (aka delete, but I guess in the instance of game 5, literally drop) the eliminated players. As we have changed their status to Eliminated, we can use this value to delete them all.
round5 = df.drop(df.index[df['Status'] == "Eliminated"])
It is also possible to drop the rows based on their name or number, but this would be done on a row by row basis, rather than removing multiple at once.
Now we can view the new DataFrame, and see our remaining players for the game.
round5.head()
Using the data
The final thing we can do is use the count function mentioned earlier, where we extracted a count value for the columns based on conditional statements. For example, if we want to print the number of players who have a status of Playing, and then for those who have status of Eliminated.
eliminated = df[df['Status'] == "Eliminated"]['Name'].count()
playing = df[df['Status'] == "Playing"]['Name'].count()
Assigning these values to a variable means we can also use these counts to create simple sentences using f strings. As the variable values are mutable, we can update these after every game when players are eliminated.
print(f"there are currently {playing} players playing")
print(f"there are currently {eliminated} players eliminated")

And not to forget a wonderful maths function, we can use the number of eliminated players and take this from the total number of players who started to get a count for the current players in the game.
total_players = 8
current = total_players - eliminated
I hope this has been a helpful (and fun) way to understand the basics of the Pandas library in Python. I'm also hoping to make more posts that go further in detail covering logical statements, merging and visualisations in Pandas.
A quick cheatsheet of these functions can be found here and a notebook to download and play around with can be found here.


Top comments (0)