Introduction:-
Customer churn is one of the major problem and very important problems in the field of Telecommunications. It directly impacts the companies revenue, particularly in the field of the Telecom Industry. Thereby, companies are trying to develop methods for predicting client attrition. Thereby, it is much important to find the factors that impact the customer churn from the company. This article provides a brief description of customer churn in the Telecom Industry, provides a churn prediction model which assists telecom companies to predict customers who are likely to churn and also provides some useful data analysis to draw insights from the data. Neural Networks, Machine Learning Algorithms & other technologies can be implemented to develop a churn prediction model that can predict with high Accuracy Score. Performance metrics like Accuracy Score, Area under Curve (AUC), Sensitivity, Specificity etc can be implemented on the model to measure the goodness of the model on test data. The Dataset consists of various parameters and multiple datasets are extracted from different Telecom companies to predict the likelihood of a customer to churn from the company so that measures can be taken by the company from being churned from the telecom company. Also, Big Data technologies could be implemented if the datasets are too big for faster calculation and easy access.
Download the Datasets and Python file(.ipynb) from the following link:-
https://github.com/ruthvikraja/Customer-Churn-Prediction.git
Dataset:-
The datasets are collected from different Telecom companies and open source databases. Each dataset consists of a different set of features because they are taken from different service providers and each provider has its own set of parameters to make a better strategy so that the customer won’t churn from the service provider. The features (or) parameters from different datasets are as follows:-
- Churn - Customers who left the service provider last month.
- Account Length (or) Tenure - This feature describes the number of months the customer has stayed with the company.
- PhoneService, MultipleLines, InternetService, OnlineSecurity, OnlineBackup, DeviceProtection, TechSupport, StreamingTV, ScreamingMovies etc - These are categorical features that describe different services opted by each customer.
- PaperlessBilling, PaymentMethod, MonthlyCharges and TotalCharges - These are the features that describe customer billing and payment methods.
- Gender, Age, Dependents etc - These are the features that describe the demographic info of a customer.
- Number of Calls, Minutes, Messages etc - These features describes the number of minutes a customer has spoken in a day, number of calls a customer has made in a day, number of messages a customer has sent to another person in a day etc.
- InternationalPlan - This feature gives information about whether a customer has opted for an international plan (or) not.
Also, the dataset consists of some additional features like the total number of minutes a customer has spoken in the Morning, Afternoon, Evening and during Nights.
The above mentioned features are some of the important features from different datasets that impacts the output parameter Churn.
Data Analysis:-
In this study, Data Analysis played a vital role than models, which were built to predict the churn of a customer from the telecom industry because data analysis provides useful insights for the companies to concentrate more on particular parameters in which they are lacking to lose and acquire more new customers.
To perform analysis on the Datasets, Uni-variate and Bi-variate analysis was performed on both categorical and numerical typed features. Uni-variate analysis was performed on each individual feature whereas the Bi-variate analysis was performed for every input feature with respect to the output feature Churn.
Uni-Variate Analysis:-
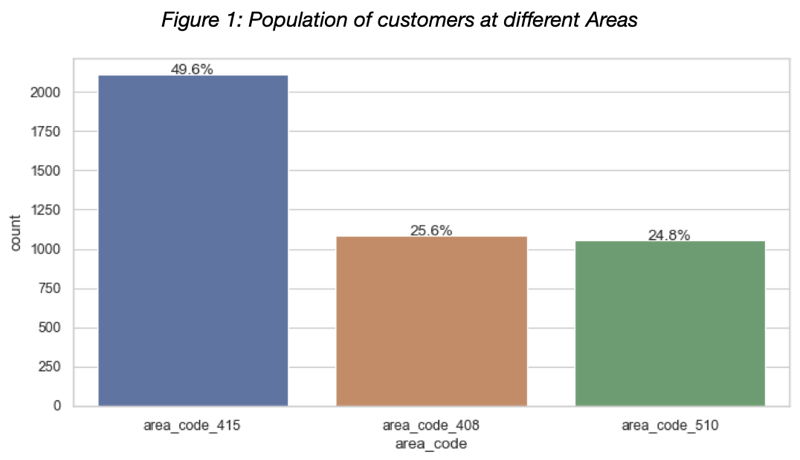
In the Figure 1, it is clear that almost 49.6% of the customers are staying at area code 415 so, it is better to provide more services and comparatively better plans for the customers who are residing at area code 415 to increase the retention period of a customer from the company.
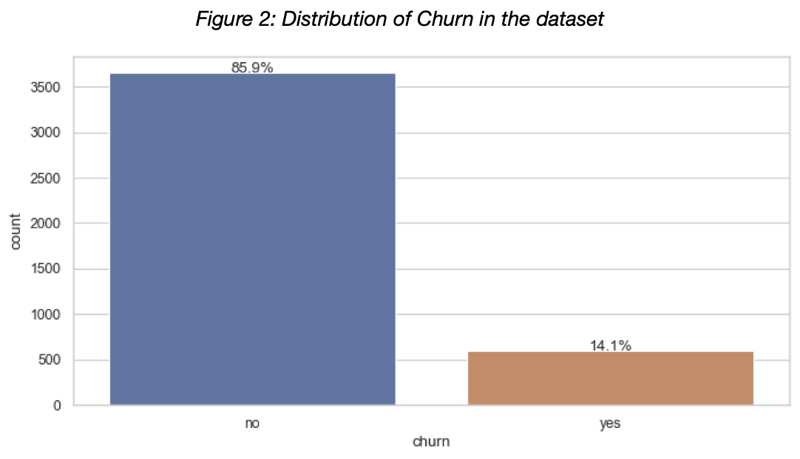
Also, from Figure 2 it is clear that the distribution of the number of customers who will leave the company is very low than the number of customers who stays with the telecom company. This creates bias due to imbalanced classes so, it is crucial to apply Upsampling technique on the minority class i.e on the data points with churn value “yes”. Thereby, the Synthetic Minority Oversampling Technique could be applied to the minority class to overcome the problem.
Bi-Variate Analysis:-
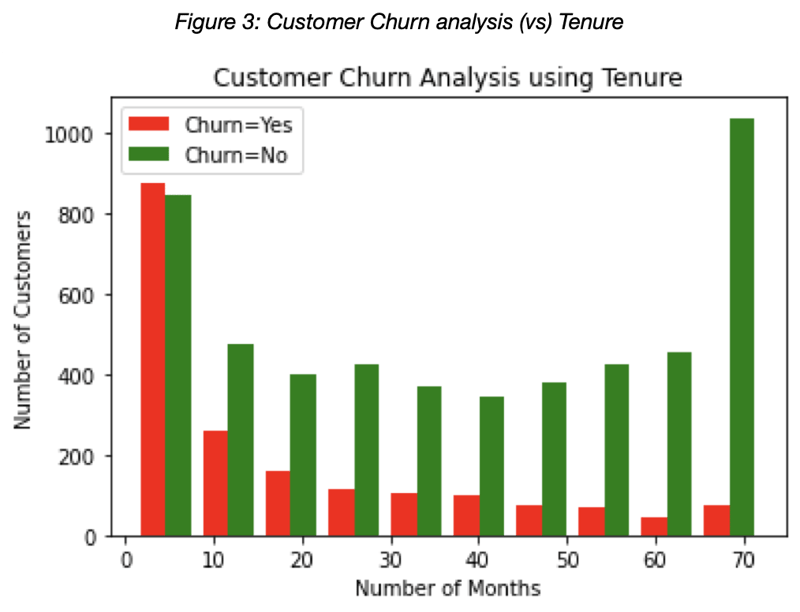
In Figure 3, it is clear that the customers with a tenure period of more than 50 months are less likely to churn from the telecom company whereas customers with a tenure period of fewer than 10 months are more likely to churn from the company so, the telecom company has to provide better deals and extra data for new customers to increase the retention period of a customer.
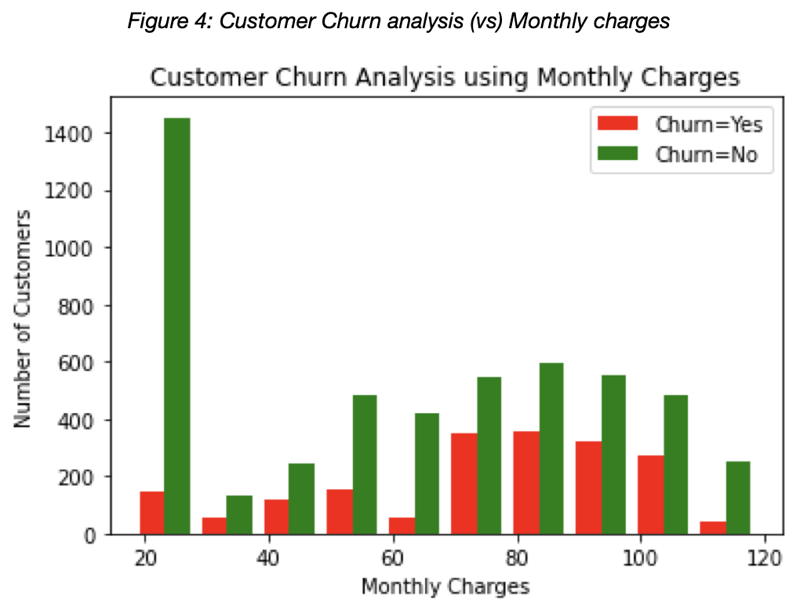
From the above Figure, it is clear that the customers who are paying very little and high monthly charges are not leaving the company whereas the customers who are paying monthly charges around $70 - $100 are having a 50% chance of leaving the company. Also, the company should concentrate more on the customers who are paying around $70 as monthly charges.
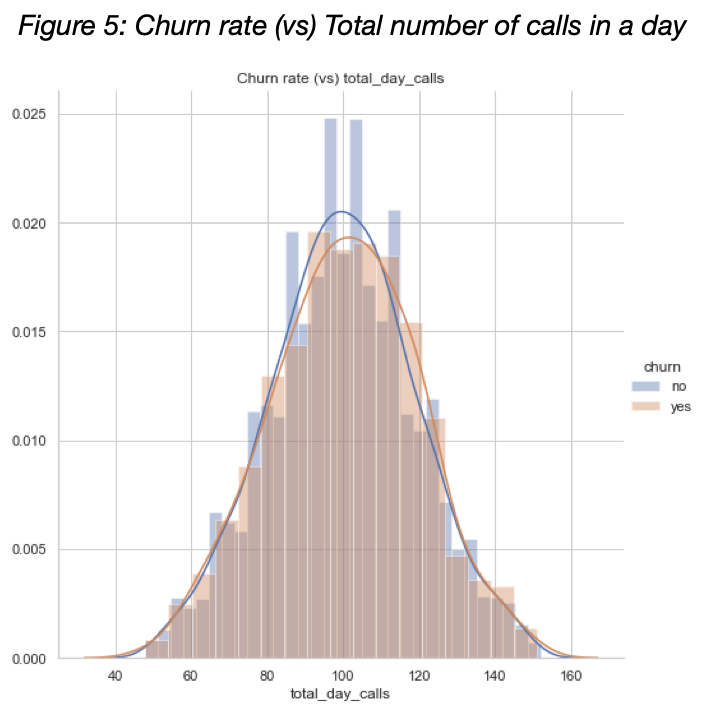
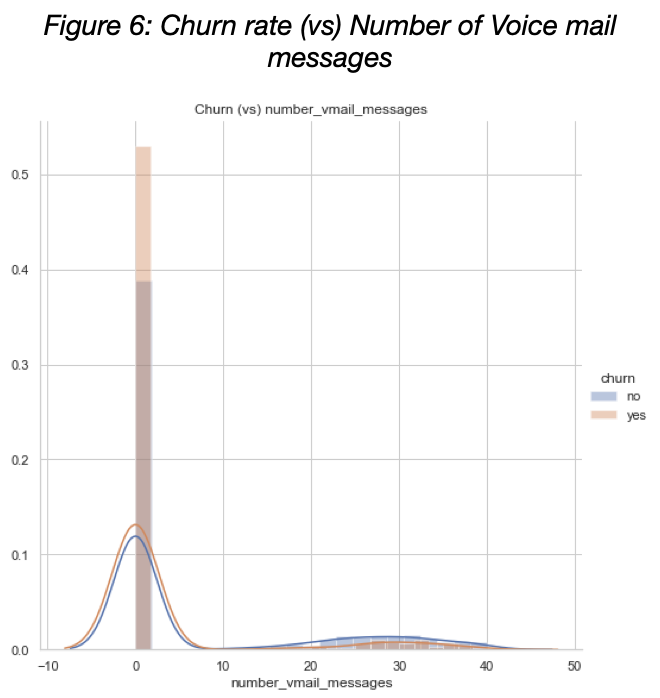
From the Figures 5 & 6, it is clear that if "The total day calls" is between 85 to 115 times then the churn rate is high and if the "Number of voice mail messages" is equal to 0, then the churn rate is very high.
Methods:-
In this Article, two different approaches have been proposed, Neural Networks based and Machine Learning based to predict the Customer Churn from a company. Many authors have proposed different algorithms that are available in Artificial Intelligence to predict the churn of a customer and found that AI technology has outperformed most of the Datasets. Also, for large datasets, Big Data technology can be implemented to store, process and retrieve the data. So, in this Article, I have chosen to build Random forest classifier and Dense Neural Networks to predict the churn of a customer.
Different weight initialisation techniques, optimisers and hidden layers are implemented to build a better predictive model.
The Neural network chosen for this study consists of 3 to 5 hidden layers for different datasets and different weight initialisation techniques, activation functions are applied on the Neural network. He Normal weight initialisation technique was implemented on neurons having activation function “Relu”, Glorot Normal (or) Xavier Normal weight initialisation technique was implemented on neurons having activation function “Sigmoid” because He Normal works well with Relu whereas Glorot Normal works well with Sigmoid activation function.
Initially, I tried implementing a Neural network with random weights but the accuracy score was not pretty good so, I tried implementing different methods on the models to achieve a better accuracy score. Also, at the output layer, the Sigmoid activation function was implemented because it will transfer the input function between 0 and 1. In the hidden layers, the Sigmoid activation function was not implemented instead Relu activation function was implemented because the Sigmoid activation function creates a Vanishing Gradient problem [The derivative of Sigmoid activation function is between 0 and 0.25 only].
Results:-
Machine Learning classification algorithms like Random Forest classifier, KNN classifier didn’t perform as expected on the first dataset i.e Telco Customer Churn, even after performing Hyperparameter tuning and Principal component analysis to capture the variability of all the features. The reason behind this not performing as expected is due to the lack of correlation between the input features and the output feature. I have implemented the Pearson correlation coefficient on the Telco customer churn dataset to find the important features that have more impact on the output feature but not even a single feature showed a high correlation value with the output parameter “Churn”. So, I tried implementing dense Neural Network to capture the input data and the results are as follows:-

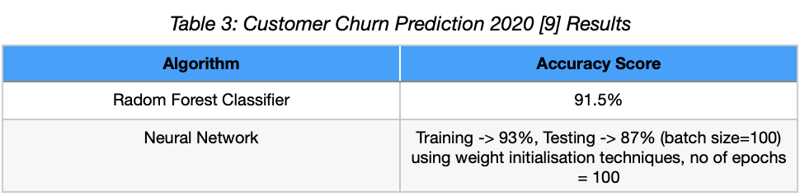
The AI algorithms have performed well on the second dataset i.e Customer Churn Prediction 2020 with more than 90% accuracy score using Machine learning algorithms. Also, I have tried implementing Artificial Neural networks on the dataset to predict the churn of a customer with a different number of epochs and weight initialisation techniques. The Accuracy scores are as follows:-
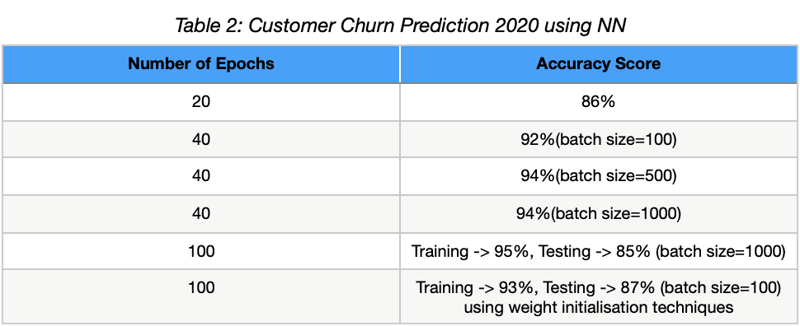
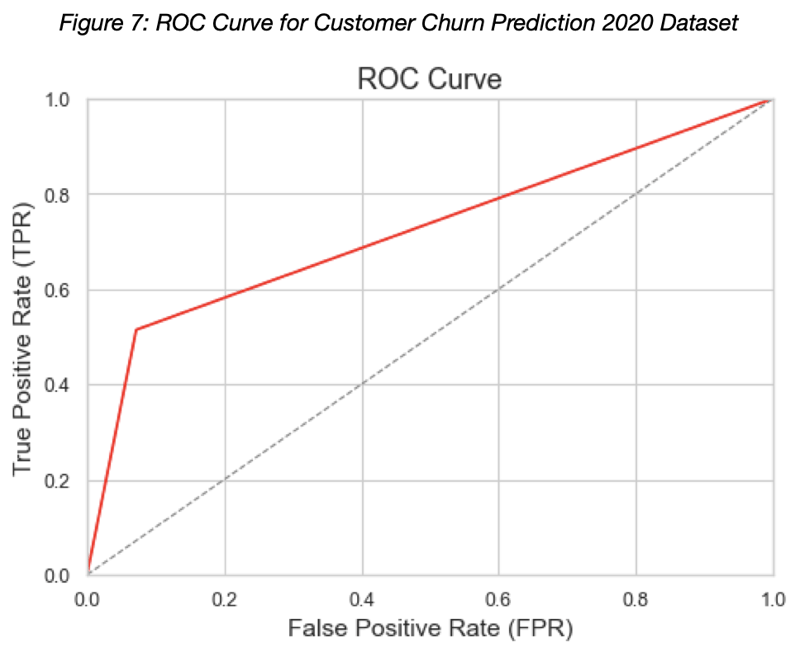
Thereby, from the above table, it is clear that implementing a Neural network using different weight initialisation techniques is better than initialising the weights randomly. Therefore, the final results i.e ROC curve and Accuracy scores are mentioned in Table 3 and Figure 7. Also, I have implemented dill library to save the current python session so, that I can continue my work from where I have left.


Latest comments (0)