Execute the following code in Overleaf for better understanding:-
Upload the following images to your Overleaf account and create a article.bib file and upload the following code:-
@Article{Jacobson1999Towards,
author = {Van Jacobson},
title = {Towards the Analysis of Massive Multiplayer Online
Role-Playing Games},
journal = {Journal of Ubiquitous Information},
Month = jun,
Year = 1999,
Volume = 6,
Pages = {75--83}}
\documentclass[12pt]{article}
%Headers
\usepackage[utf8]{inputenc}
\usepackage{amsmath} % American Mathematical Society
\usepackage{graphicx} % This allow us to import images to our file
\usepackage{multirow}
\usepackage{natbib} % Used for REFERENCES
\usepackage{tabularx} % Used for creating Tables

\title{Welcome To LATEX}
\author{Myself}
\date{January 2021}

% Till this the initial portion is known as preamble.

\begin{document}
\maketitle      % If you use this then only the above title, author and date                 % will be displayed

\section{INTRODUCTION}
% when you give\(backslash) you are telling the compiler that you are gonna give some command

\begin{enumerate} % This will assign numbers to each item
\item Let us begin with a formulae : This can be included between two dollar signs.
$e^{i\pi}+1=0$ % pi is an inbuilt command

% The above is a one line equation but we can make our own equation environment by using double $$ signs

$$ e=\lim_{n\to\infty}\left(1+\frac{1}{n}\right)^n = \lim_{n\to\infty}\frac{n}{\sqrt[n]{n!}} $$ % Here we are telling that they are left and right brackets

% \sqrt[n] means we are displaying nth root not the square root
% Here \to will create an arrow and \infty means infinity

\item Let us create a formulae having summation:

$$ e=\sum_{n=0}^{\infty} \frac{1}{n!} $$
% Here sum_(sum underscore){n=0} will print n=0 under the summation symbol i.e lower limit and ^ \infty means it prints at the top of the summation symbol which is known as upper limit

\item We can also create a continuous formulae as follows:

$$ e=2+\frac{1}{1+\frac{1}{2+\frac{2}{3+\frac{3}{4+\ddots}}}} $$

\end{enumerate}
% If you don't like numbers then we can mention {itemize} which will create dots(.) instead of numbers for each item.

\section*{More Formulae} % using * will not create a number for this section
\subsection{Formulae in maths} % creating a subsection

To display formulae containing integrals:

$$ \int_{a}^{b} f(x)dx $$
$$ \iiint f(x,y,z)dxdydz $$
$$ \Vec{v}=v_1,v_2,v_3 $$.    % Vectors
$$ \Vec{v} \cdot \Vec{u}$$ % \cdot is used to print a dot b/w the vectors

Some more useful formulaes and equations:
$ \mu=e^{q/rt} $\\
$ \Omega != \omega $
$ \pm $ % prints + and -
\begin{equation*}
    \min_{x,y}{(1-x)^2 + 100(y-x^2)^2}
    \beta_i = \frac{\operatorname{Cov}(R_i,R_m)}{\operatorname{Var}(R_m)}
\end{equation*} % Use equation* for unnumbered equations:

% Adding a Matrix :
$$
\begin{bmatrix}
1 & 2 & 3\\ % This will go to a new line
4 & 5 & 6\\
7 & 8 & 9\\
\end{bmatrix}
$$

% Let us add an image
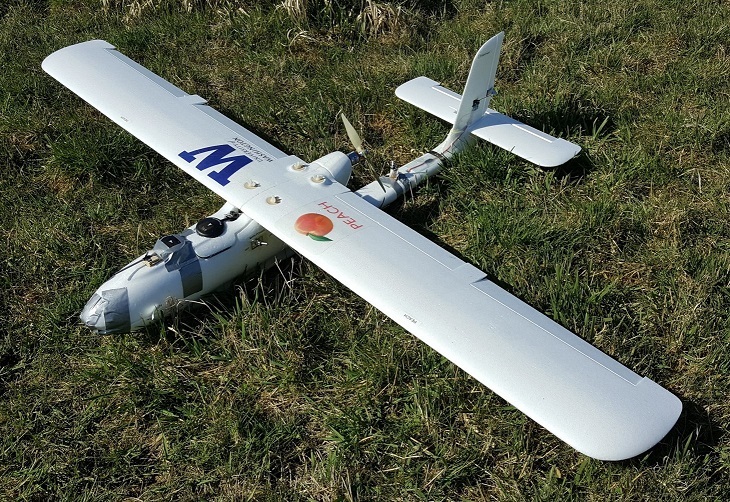
\includegraphics{Aircraft.jpg}\\

% SOME MORE USEFUL INSIGHTS USING LATEX :

\begin{figure}
    \centering
    \includegraphics{sample.png}
    \caption{Caption}
    \label{fig:my_label}
\end{figure}

% Aligning a sequence of equations at the equals sign:
% Here the & (ampersand) separates the left column before the " = " from the right column after the " = " and a double backslash start a new line.
\begin{align*}
    (x+1)^3 &= (x+1)(x+1)(x+1)\\
            &= (x+1)(x^2+2x+1)\\
            &= x^3+3x^2+3x+1
\end{align*}

% Use the abstract environment to make an abstract -> begin{abstract} end{abstract}

% LABELS AND CROSS - REFERENCES :-
% Use \label and \ref for automatic numbering.[Used for labeling the section and referencing them]

\section{Let us create some tables}
% TABLES:-
% Use the tabular environment from the tabularx package
% The argument specifies column alignment - left, right, right :-
% It also specifies vertical lines, use \hline for Horizontal Line

\begin{tabular}{|l|r|r|r|}\hline
    item & qty & unit \$ & status\\ \hline
    a & 1 & 199 & 1 \\
    b & 2 & 299 & 1\\
    c & 3 & 399 & 1\\\hline
\end{tabular} \\ \\ \\

% A table with column headings spanning over several columns can be created using the command \multicolumn{cols}{position}{text}.

\begin{center}
    \begin{tabular}{|c|c|r|} \hline
      \multicolumn{3}{|c|}{Title} \\ \hline
      1 & 1 & 1 \\
      2 & 2 & 2  \\ \hline
      3 & 3 & 3 \\ \hline
      4 & \multicolumn{2}{|r|}{4} \\ \hline

    \end{tabular}
\end{center} \\ \\ \\

\label{sec:Table}
\begin{tabular}{|c||l|l|l||l|l|l|} \hline
\label{tab:1}
\multirow{2}{*}{Title} & \multicolumn{3}{|c|}{Category A} & \multicolumn{3}{|c|}{Category B} \\ \cline{2-7}
& item 1 & item 2 & item 3 & item 1 & item 2 & item 3 \\ \hline
A & 1 & 2 & 3 & 1 & 2 & 3 \\ \hline
b & 1 & 2 & 3 & 1 & 2 & 3 \\ \hline
\end{tabular} \\

In the section \ref{sec:Table}, we have created a table with reference number \ref{tab:1}.

\section{Labels}
\label{sec:intro}
In section \ref{sec:method}, we \ldots

\section{Method}
\label{sec:method}
\begin{equation}
\label{eq:euler}
e^{i\pi} + 1= 0
\end{equation}

By \eqref{eq:euler}, we have \ldots

% REFERENCES :
\citep{Jacobson1999Towards}.
\bibliography{article}
\bibliographystyle{aiaa}
\end{document}


Oldest comments (0)