In this post, we present Linear Regression analysis using one variable example. The idea is to keep the examples as simple and straightforward as possible, so you can focus on the intuition behind Linear Regression and don't get confused with too much data preparation or other details about tools and data manipulation. There are many algorithms to perform regression analysis, but Linear Regression is the simplest of them and the recommended algorithm to start with.
In Linear Regression we predict an output value y using a linear model. In other words, from an input variable x we use a simple equation of the form:
y = ax + b
to predict the value of y. Because we already chose the type of the model (the linear model), the task of the algorithm is to find the parameters a and b to define the linear equation which best fits our data. In the example below, we use the data from the House Price dataset from Kaggle and Python tools to build 3 Linear Regression models to predict the sale price of a house (output variable). Each model uses a different attribute as an input variable, and we use the scikit-learn library to build our linear models. Finally, we plot our models together with the real data so we can visualize how well the linear model fits the data.
Building a Linear Regression Model with Python
The first step we load the dataset into a Pandas dataframe, select only the continous variables, and then we print information about our dataset:
url = 'https://raw.githubusercontent.com/rodmsmendes/' +
     'reinforcementlearning4fun/master/' +
     'data/house_prices.csv'
df = pd.read_csv(url)
df_float = df.select_dtypes(include=['float64']).copy()
df_float.info()
So the resulting dataset has 3 continous attributes, and we find that all of them has missing values:
<class 'pandas.core.frame.DataFrame'>
RangeIndex: 1460 entries, 0 to 1459
Data columns (total 3 columns):
LotFrontage    1201 non-null float64
MasVnrArea     1452 non-null float64
GarageYrBlt    1379 non-null float64
dtypes: float64(3)
memory usage: 34.3 KB
We complete then using the mean value of the respective attributes:
df_float['LotFrontage'] = df['LotFrontage']
    .fillna(df['LotFrontage'].mean(), inplace=False)

df_float['MasVnrArea'] = df['MasVnrArea']
    .fillna(df['MasVnrArea'].mean(), inplace=False)

df_float['GarageYrBlt'] = df['GarageYrBlt']
    .fillna(df['GarageYrBlt'].mean(), inplace=False)
Once the the missing values are filled we can build our models. For each model, we create an instance of the LinearRegression class from scikit-learn. Then we use one of the selected continous variables as input and the output variable SalePrice to train the model:
lotFrontage = df_float[['LotFrontage']]
salePrice = df['SalePrice']

lr1 = LinearRegression()
lr1.fit(lotFrontage, salePrice)
What we did here was to use the method fit() to train a linear regression model over the input data lotFrontage and given the output salePrice. The state of the model is stored in the LinearRegression model references by the lr1 variable. Using this variable, we print the model coefficients as well as the mean squared error score to asssess the quality of the model:
print(lr1.coef_)
print(lr1.intercept_)
print(mean_squared_error(salePrice,
    lr1.predict(lotFrontage)))
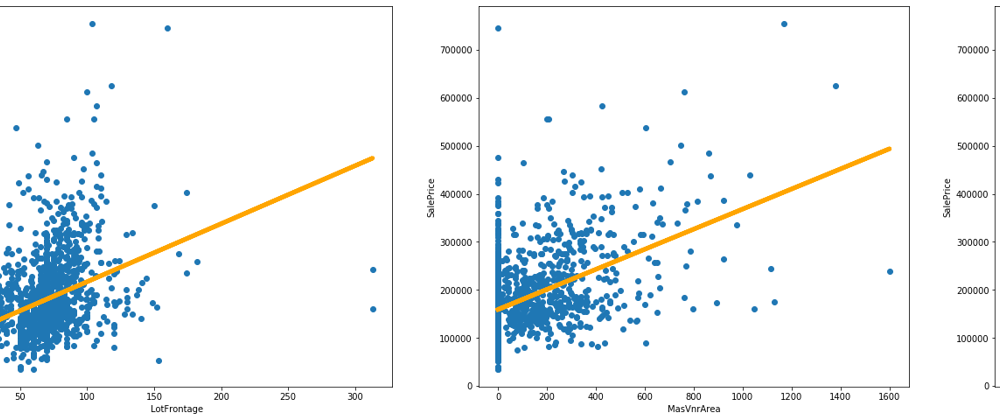
Finally, we plot the resulting models (in orange) together with the real data (blue points), so we can compare then.

Conclusion
In this example, we used the Linear Regression as a exploratory data analysis tool. Usign the scikit-learn libray we create Linear Regression models to understand if the target attribute SalePrice can be explained in terms of LotFrontage, MasVnrArea or GarageYrBlt individually. Finally, the results of modeling are presented ploting them together with the data points.
You can find this complete example as a Kaggle kernel. In this kernel, you will find all the steps needed to create a Linear Regression model using scikit-learn and other Python tools. I strongly suggest that you open and execute this notebook to see the code in action. Then, fork the kernel to create your copy and try to modify the code, using other variables, another dataset, creating new visualizations, and so on. You can access the kernel by clicking the link below:


Top comments (2)
I have a doubt, you said Fill null values with Median in Written but in the command line you stored mean value. Can any explain me.
Hi @maheshthedev , that was a mistake in the text. Fixed. Thanks for the observation.