In my previous article, I mentioned I will talking more about Chart::Plotly. Today is that day. So without further ado lets get started.
As mentioned in Chart::Plotly - Chart::Plotly helps you to html/javascript charts from perl data using javascript library plotly.js. The result is a file that you could see in your favorite browser. Also you can save the image locally and use it as per your need.
Plotly.js is very powerful which offers a lot of feature and wide variety of charts. It is built on top of d3.js and stack.gl. The charts are fully customizable. You can provide all the configurations in declarative format (JSON) and it takes care of the rest. You don't need to be a javascript expert to use this as all the complexity is taken care of. There are lot of examples available and plenty of documentation for your help. Also it support statistical and scientific charts.(You can use Chart::Plotly with PDL too.)
So lets get started.
Creating the data config
We will use the exact same example as in previous article and try to create a multi line chart.
{
    "title": "Number of automobiles sold per day by manufacturer",
    "domainAxis": {
        "data": ["2020-04-15", "2020-04-16", "2020-04-17", "2020-04-18"],
        "label": "Date"
    },
    "rangeAxis": {
        "lines": {
            "line1": {
                "data": [10,3,5,9],
                "legendName": "Honda"
            },
            "line2": {
                "data": [20,15,8,10],
                "legendName": "Toyota"
            },
            "line3": {
                "data": [6,19,12,4],
                "legendName": "Ford"
            },
            "line4": {
                "data": [16,10,6,12],
                "legendName": "Renault"
            }
        },
        "label": "Numbers of automobiles sold"
    }
}
This is the config which contains the data for multi line chart.
domainAxis(x-axis) is a date axis while rangeAxis(y-axis) have 4 lines.
Directory structure
Our directory structure will be simple. input for input data, output for generated chart, lib for perl module.
┣ 📂input
┃ ┗ 📜input_data.json
┣ 📂lib
┃ ┗ 📜CreateLineCharts.pm
┣ 📂output
┣ 📜multi_line_chart.pl
┗ 📜README.md
Creating the module
One good thing about this module is- the documentation of plotly.js is rqually applicable here. So even the documentation is little sparse in Chart::Plotly, the documentation in plotly.js comes to rescue and you can use the exact same names and keywords in your perl code without any issue. Also, similar examples are available in python version also on the plotly.js website. So if you understand little bit of any of these 3 languages it is a cakewalk for you in other one.
So, lets create our module.
package CreateLineCharts;
use strict;
use warnings;

# https://plotly.com/javascript/line-charts/
use Chart::Plotly 'show_plot';
use Chart::Plotly::Image 'save_image';
use Chart::Plotly::Plot;
use Chart::Plotly::Trace::Scatter;

sub generate_line_chart {
    my ($self, $chart_out_file, $chart_data) = @_;

    my $x_axis = $chart_data->{domainAxis};
    my $y_axis = $chart_data->{rangeAxis};

    my $plot = Chart::Plotly::Plot->new();
    foreach my $y_line (keys %{$y_axis->{lines}}) {
        my $scatter = Chart::Plotly::Trace::Scatter->new(
            x    => $x_axis->{data},
            y    => $y_axis->{lines}->{$y_line}->{data},
            name => $y_axis->{lines}->{$y_line}->{legendName}
         );
        $plot->add_trace($scatter);
    }

    # Opens the plot or plots in a browser locally
    show_plot($plot);

    # https://metacpan.org/pod/Chart::Plotly::Image#save_image
    save_image(
        file   => $chart_out_file,        # Referring to a local filesystem path
        plot   => $plot,
        width  => 1024,                   # Sets the image width
        height => 768,                    # Sets the image height
        engine => 'auto'
    );
}
Here we are just going through each line and creating a Chart::Plotly::Trace::Scatter object and adding it to plot.
There are 2 functions which I would like to point out -
-
show_plotfunction will open the generated chart in you favorite browser locally. -
save_imagewill save the generated file locally in your local filesystem. This will be useful when you want to send this as mail attachment in automated fashion. You can use anyone of them based on your requirement or both.
Using the module
Let create our startup script to access this module for creating our chart.
#!/usr/bin/env perl

use strict;
use warnings;
use Cwd qw( abs_path );
use File::Basename qw( dirname );
use JSON;

BEGIN {
    $ENV{"SCRIPT_DIR"} = dirname(abs_path($0));
}

use lib $ENV{"SCRIPT_DIR"} . "/lib";
use CreateLineCharts;

my $chart_out_file = $ENV{"SCRIPT_DIR"} . "/output/lineChart.png";

sub read_json_file {
    my ($json_file) = @_;
    print "\nReading $json_file\n";

    open(my $in, '<', $json_file) or print "Unable to open file $json_file : $!";
    my $json_text = do { local $/ = undef; <$in>; };
    close($in) or print "\nUnable to close file : $!";

    my $config_data = decode_json($json_text);
    return $config_data;
}


sub main {
    my $data_in_json = read_json_file($ENV{"SCRIPT_DIR"} . "/input/input_data.json");

    my $chart = CreateLineCharts->new();
    $chart->generate_line_chart($chart_out_file, $data_in_json);

}

main;
We are reading the JSON data from input file and calling generate_line_chart of our module with it.
Running the script
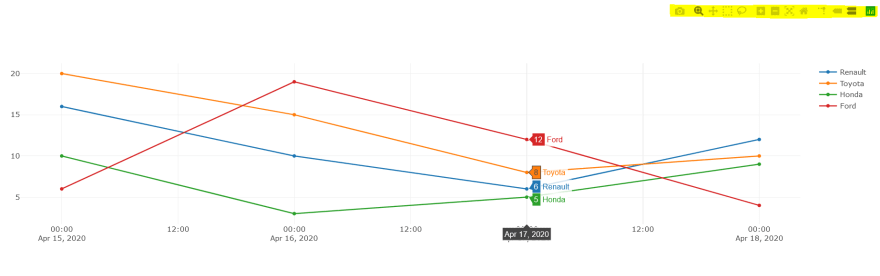
Now just run the above script and see the output. Running the script will automatically open your favorite browser with the chart. The output will be generated in 2 places.
- On the browser
- Locally in
outputdir Both are similar chart. Of course, the browser one is dynamic and interactive chart and the local filesystem one is static.
Also there are several other options available when you hover over the chart in browser. You can see them at top right corner(highlighted in yellow).
Both are similar chart. Of course, the browser one is dynamic and interactive chart and the local filesystem one is static.
Also there are several other options available when you hover over the chart in browser. You can see them at top right corner(highlighted in yellow).
That's it. You have your multi line chart with minimal code. There are lot of configuration options available. The default generated chart is already good enough. In case you are interested in more options proceed ahead.
Bonus - If you noticed the url in your browser, you can see the .html file is created in temp location. Go to that location and try to open that file in your favorite editor(or you can inspect element and see there).
<!DOCTYPE html>
<head>
<meta charset="utf-8" />
</head>
<body>
<div id="1ca037ff-8fd4-11eb-bd22-b212bed9e091"></div>
<script src="https://cdn.plot.ly/plotly-1.52.2.min.js"></script>
<script>
Plotly.react(document.getElementById('1ca037ff-8fd4-11eb-bd22-b212bed9e091'),[{"y":[16,10,6,12],"x":["2020-04-15","2020-04-16","2020-04-17","2020-04-18"],"name":"Renault","type":"scatter"},{"x":["2020-04-15","2020-04-16","2020-04-17","2020-04-18"],"y":[20,15,8,10],"type":"scatter","name":"Toyota"},{"name":"Honda","type":"scatter","y":[10,3,5,9],"x":["2020-04-15","2020-04-16","2020-04-17","2020-04-18"]},{"x":["2020-04-15","2020-04-16","2020-04-17","2020-04-18"],"y":[6,19,12,4],"type":"scatter","name":"Ford"}]  );
</script>
</body>
</html>
The above template is generated by Chart::Plotly only(Precisly here). The div id gets randomly generated at each time. After that we are using Plotly.react to create a plot.
Some advanced config options
As I mentioned before plotly.js is powerful and highly configurable. Now lets take a look at those configuration.
In case you are not happy with default config you can change it as per your need. These configuration ranges from styling the plot lines, changing the layout, legend, marker, font, color, text anything you want.
Now lets add these configuration to our module.
package CreateLineCharts;
use strict;
use warnings;

# https://plotly.com/javascript/line-charts/
use Chart::Plotly 'show_plot';
use Chart::Plotly::Image 'save_image';
use Chart::Plotly::Plot;
use Chart::Plotly::Trace::Scatter;

use HTML::Show;

use JSON;
use Data::Dumper;

sub new {
    my ($class, @arguments) = @_;
    my $self = {@arguments};
    bless $self, $class;
    return $self;
}

sub _generate_plot_lines {
    my ($self, $plot, $x_line, $y_line) = @_;

    # https://metacpan.org/pod/Chart::Plotly::Trace::Scatter
    # https://plotly.com/javascript/reference/scatter/
    my $scatter = Chart::Plotly::Trace::Scatter->new(
        x    => $x_line->{data},
        y    => $y_line->{data},
        name => $y_line->{legendName},

        # mode => 'markers',                 # Add markers at data points instead of line
        marker => {
            symbol  => 'diamond',            # Default - circle
            size    => 8,                    # marker size(in px). Default - 6px
            opacity => 0.8,                  # Marker opacity (0-1)
            # color   => 'red'               # Sets the marker color
        },
        opacity => 0.8,
        # text => $x_line->{data}            # Extra text you want to show on mouse hover over all the data points.

        # https://metacpan.org/pod/Chart::Plotly::Trace::Scatter::Line
        line => {
            # width   => 3,                  # Width of line, Default: 2
            # color   => '#45b5c6',          # Color of the line
            shape     => "spline",           # Determines the line shape - one of("linear" | "spline" | "hv" | "vh" | "hvh" | "vhv"), Default: "linear"
            smoothing => 0.5,                # Used only if `shape` is set to "spline", Default: 1
            dash      => "solid",            # Dash style of line - ("solid", "dot", "dash", "longdash", "dashdot", or "longdashdot"). Default: "solid"
            simplify  => JSON::false,        # Simplifies lines by removing nearly-collinear points. Default: true
        }
    );
    return $scatter;
}

sub _add_layout {
    my ($self, $plot, $chart_title, $x_axis_title, $y_axis_title) = @_;
    $plot->layout(
        {
            title => $chart_title,
            # font  => {                          # Sets the global font
            #     family => "Open Sans",          # Default font - ""Open Sans", verdana, arial, sans-serif"
            #     size     => 14                  # default - 12px
            # },
            # https://plotly.com/javascript/legend/
            legend => {
                # orientation => "h",             # Sets the orientation of the legend('v' or 'h'). Default - v(vertical)
                # xanchor     => "left",          # Sets the legend's horizontal position anchor. "left", "center" or "right"
                # yanchor     => "bottom",        # Sets the legend's vertical position anchor. "top", "middle" or "bottom"
                # x           => 0,               # number between or equal to -2 and 3
                #                                 # Sets the x position (in normalized coordinates) of the legend.
                #                                 # Defaults to "1.02" for vertical legends and defaults to "0" for horizontal legends.
                # y           => -0.1,            # number between or equal to -2 and 3
                #                                 # Sets the y position (in normalized coordinates) of the legend.
                #                                 # Defaults to "1" for vertical legends, defaults to "-0.1" for horizontal legends on graphs w/o range sliders and defaults to "1.1" for horizontal legends on graph with one or multiple range sliders.

                bgcolor     => "#ffffff",         # Sets the legend background color . Defaults to `layout.paper_bgcolor`
                bordercolor => "#333333",         # Sets the color of the border enclosing the legend . Default - #444
                borderwidth => 1,                 # Sets the width (in px) of the border enclosing the legend. Default - 0
                font => {                         # Sets the font used to text the legend items.
                    size  => 14,
                    color => "#000000"            # Black
                },
                # title => {                      # Sets the title of the legend. Default - ""
                #     text => "Legend",
                #     font => {size => 14, color => "black"},
                #     side => "top"               # Location of legend's title with respect to the legend items
                # }
            },

            # showlegend => JSON::false,                # Whether you want to display the legend on not. Default - true
            # https://plotly.com/javascript/axes/
            # https://plotly.com/javascript/tick-formatting/
            xaxis => {
                title      => $x_axis_title,            # Text label for x-axis
                type       => "-",                      # x-axis type
                automargin => JSON::true,
                linecolor  => "#333333",                # Sets color of X-axis line
                # titlefont  => {color => '#0066ff'},   # Title font formating
                # tickfont   => {color => '#0066ff'},
                zeroline   => JSON::true,               # Show zero line or not
                zerolinecolor => '#cccccc',             # Assign specific color to zero line
                zerolinewidth => 4,

                # showgrid => JSON::false               # Removes X-axis grid lines
                # rangeslider => { visible => JSON::false },
                # gridcolor   => '#bfbfbf',
                # gridwidth   => 1,
                # tickformat => "YYYY-MM-DD",           # d3-format specifier. If empty or "" plotly will attempt to guess format
                # dtick       => 1                      # step in-between ticks
            },
            yaxis => {
                title      => $y_axis_title,
                tickformat => "",                       # d3-format specifier. If empty or "" plotly will attempt to guess format.
                automargin => JSON::true,
                linecolor  => "#333333",                # Sets color of Y-axis line
                # titlefont  => {color => '#0066ff'},
                # tickfont   => {color => '#0066ff'},
                rangemode  => "tozero",                 # Forced to start from zero. Default - "normal"
                automargin => JSON::true,
                zeroline   => JSON::true,               # Show zero line or not
                # showgrid => JSON::false               # Removes Y-axis grid lines
                # side => "left",                       # Location of y-axis. "left" or "right"
                # gridcolor => '#bfbfbf',               # Assign specific color to grid
                # gridwidth => 1,
                # dtick => 1                            # step in-between ticks
            },
            paper_bgcolor => "#ffffff",                 # Sets the background color of the paper where the graph is drawn. Default - #FFF
            plot_bgcolor => "#ffffff",                  # Sets the background color of the plotting area in-between x and y axes.
            margin => {                                 # Default(in px): left(80), right(80), top(100), bottom(80)
                'l' => 50,
                'r' => 50,
                't' => 50,
                'b' => 50
            },
            width  => 1000,                             # Sets the plot's width. Default - 700px
            height => 750,                              # Sets the plot's height. Default - 450px
        }
    );
}

sub _add_config {
    my ($self, $plot) = @_;
    # https://plotly.com/javascript/configuration-options/
    my %config = (
        scrollZoom => JSON::true,                   # mousewheel or two-finger scroll zooms the plot
        editable   => JSON::true,                   # In editable mode, users can edit the chart title, axis labels and trace names in the legend
        # staticPlot => JSON::true,                 # Create a static chart
        toImageButtonOptions => {                   # Customize Download Plot Options
            format   => 'svg',                      # one of png, svg, jpeg, webp. Default - png
            filename => 'multi_line_chart',         # Default name - newplot
            height   => 550,
            width    => 800,
            scale    => 1                           # Multiply title/legend/axis/canvas sizes by this factor
        },
        # displayModeBar => JSON::true,             # Force The Modebar at top to Always Be Visible.
                                                    # By default, the modebar is only visible while the user is hovering over the chart.
                                                    # Making it 'false' will never Display The Modebar
        modeBarButtonsToRemove => ['sendDataToCloud'],          # Delete some buttons from the modebar

        showLink        => JSON::true,                          # Display the `Edit Chart` Link
        plotlyServerURL => "https://chart-studio.plotly.com",   # Here you can directly edit your chart in browser
        linkText        => 'Edit chart in chart studio',

        # locale        => 'fr',                    # Change the Default Locale.
                                                    # More info - https://github.com/plotly/plotly.js/blob/master/dist/README.md#to-include-localization
        displaylogo      => JSON::false,            # Hide the Plotly Logo on the Modebar
        # responsive     => JSON::true,             # Responsive to window size
        # doubleClickDelay => 1000,                 # maximum delay between two consecutive clicks to be interpreted as a double-click in ms (default 300 ms)
    );
    $plot->config(\%config);
}

sub generate_line_chart {
    my ($self, $chart_out_file, $chart_data) = @_;

    my $x_axis = $chart_data->{domainAxis};
    my $y_axis = $chart_data->{rangeAxis};

    my $plot = Chart::Plotly::Plot->new();
    foreach my $y_line (keys %{$y_axis->{lines}}) {
        my $scatter = $self->_generate_plot_lines($plot, $x_axis, $y_axis->{lines}->{$y_line});
        $plot->add_trace($scatter);
    }

    $self->_add_layout($plot, $chart_data->{title}, $x_axis->{label}, $y_axis->{label});

    $self->_add_config($plot);

    my $html = $plot->html(
        div_id => 'my_div_id',                          # Id of the div, in which you want your chart to be embedded
        load_plotly_using_script_tag => 'embed'         # Can be : 1 or cdn, embed, module_dist.
                                                        # * By default, it is 1(cdn) meaning it will load plotly.js using cdn link.
                                                        # * 'embed' will take it from the plotly.js that is shipped wth Chart::Plotly and paste it within <script> tag.
                                                        # * 'module_dist' is similar to 'embed' except it will provide the source in <script src="file://">.
                                                        # Please note that using 'module_dist' will show the actual location of the file on your location machine(e.g. /usr/lib/perl/5.30/site/lib/Chart-Plotly/plotly.js/plotly.min.js).
                                                        # So, beware of this as you will be showing this location in your browser
    );

    # Returns the structure suitable to serialize to JSON corresponding to the plot
    # print Dumper($plot->TO_JSON);

    # Returns the plot serialized in JSON . Not suitable to use in nested structures
    # print Dumper($plot->to_json_text);

    # Opens the plot or plots in a browser locally.
    # Both are equal. In second statement we are just updating the div id with user defined one and determining how to load plotly.js
    show_plot($plot);
    HTML::Show::show($html);

    # https://metacpan.org/pod/Chart::Plotly::Image#save_image
    save_image(
        file   => $chart_out_file,          # Referring to a local filesystem path
        format => "png",                    # Supported formats are png, jpeg, webp, svg, pdf, eps.
                                            # By default it's inferred from the specified file name extension
        scale => 1,                         # Multiply title/legend/axis/canvas sizes by this factor
        plot  => $plot,
        # width  => 1024,                   # Sets the image width
        # height => 768,                    # Sets the image height
        engine => 'auto'
    );
}

1;
I know its overwhelming. But, I spend quite a few time just to know what each configuration does. I have added those as comments with do and don't in front or top of those config options.
I have gone through ploty.js doc and tried those in perl version. To my surprise each and every one of them worked in perl world. As I mentioned before the documentation of Chart::Plotly can be improved and this example can help someone working on it for first time.
Also you can look at examples section of Chart::Plotly for more examples of different charts.
Now, lets run and see the output again. There will be 3 output generated. Two in browser and one in local dir.
Some thing I would like to point.
-
show_plot($plot)- The first output in browser is generated form here.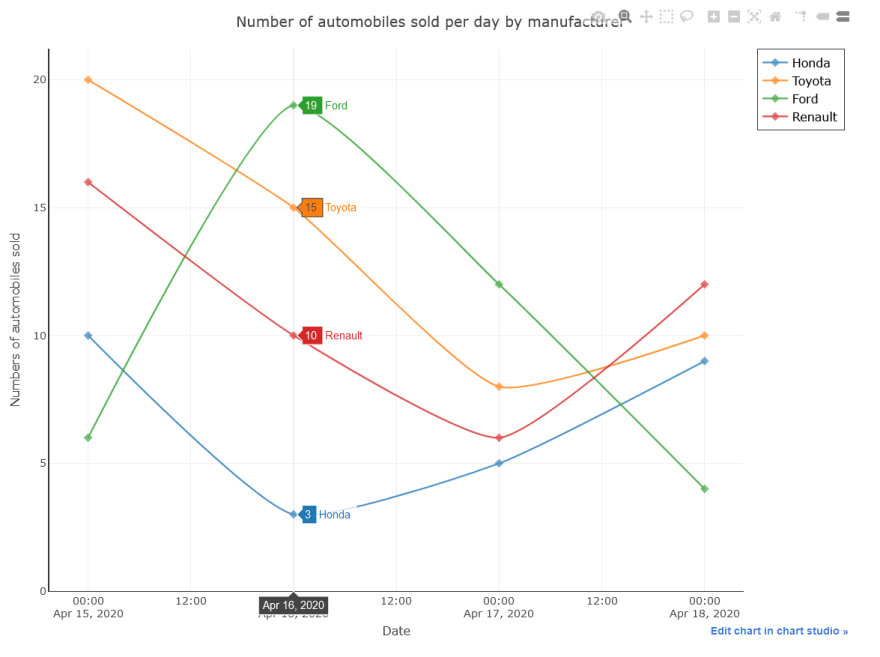
-
HTML::Show::show($html)- The second output in browser is generated from here. This statement is similar to first one with only 2 difference. One being thediv_idwhich we are using as user defined. Second being, how to get plotly.js for generating chart(through cdn or the one shipped with Chart::Plotly etc). Inspect element and check the difference between this and first point, you will understand. Below you can see the 'div' id is user defined and<script>tag contains plotly.js as embeded instead of cdn link.
-
save_image- The third chart generated locally is from this function.
-
$plot->TO_JSON- Returns the structure suitable to serialize to JSON corresponding to the plot. You can dump it to see what is exactly happening inside chart. You will see all the config and set options. -
$plot->config(\%config)- Extra config for the chart. These are mostly specific to chart which you are seeing in browser. -
JSON::falseandJSON::true- As perl doesn't have boolean, I am using this for setting the config option as false or true depending on the javascript false or true. You can use any other JSON module for similar purpose if you want.
As mentioned, I have only created multi line chart but there are multiple options available each one having there one configuration. You can choose from them.
I hope you got some clarity on how to use this module. So, next time when you got any opportunity to create chart you know what to use.
The above example is also available at github.
Perl Onion logo taken from here
Plotly logo taken from here
Chart image in cover taken from here


Latest comments (3)
Excelent, this is the type of web sites that are required to spread the use of Perl modules. Thank you for the contribution, it helped me a lot.
Awesome...
👍 👍 👍