
Your cloud infrastructure can scale in real time with your application without making a configuration change or writing a line of code. Autoscaling is the process of increasing or decreasing the capacity of application workloads without human intervention. When tuned correctly, autoscaling can reduce costs and engineering toil in maintaining the applications.
The overall process of enabling autoscaling is simple. It begins with determining the set of metrics that can provide an indicator for when Kubernetes should scale the application capacity. Next, a set of rules determines whether the application should be scaled up or down. Finally, using the Kubernetes APIs, the resources available to the application are expanded or contracted to accommodate the work that the application must perform.
Autoscaling is the process of increasing or decreasing the capacity of application workloads without human intervention. When tuned correctly, autoscaling can reduce costs and engineering toil in maintaining the applications. The overall process of autoscaling is simple. It begins with determining the set of metrics that can provide an indicator for when Kubernetes should scale the application capacity. Next, a set of rules determine whether the application should be scaled up or down. Finally, using the Kubernetes APIs, the resources available to the application are expanded or contracted to accommodate the work that the application must perform.
Autoscaling is a complex process, and it serves some categories of applications better than others. For example, if an application’s capacity requirements don’t change often, you will be better off provisioning resources for the highest traffic that the application will handle. Similarly, if you can predict the application load reliably, you can manually adjust the capacity at those times rather than investing in an autoscaling solution.
Apart from the variable load on the application, other primary motivations for autoscaling include managing costs and capacity. For example, cluster autoscaling allows you to save money on public clouds by adjusting the number of nodes in your cluster. Also, if you have a static infrastructure, autoscaling will enable you to dynamically manage the allocation of capacity to your workloads so that you can optimally utilize your infrastructure.
At a high level, autoscaling can be divided into two categories:
- Workload autoscaling: Dynamically managing capacity allocation to individual workloads.
- Cluster autoscaling: Dynamically managing the cluster’s capacity.
Let’s first dive into the details of scaling workloads in Kubernetes. Some of the standard tools used for autoscaling workloads on Kubernetes are Horizontal Pod Autoscaler (HPA), Vertical Pod Autoscaler (VPA), and Cluster Proportional Autoscaler (CPA). To work with the autoscalers, we need a cluster and a simple test application, which we will set up next.
Creating a Linode Kubernetes Engine Cluster
Linode offers a managed Kubernetes offering known as Linode Kubernetes Engine (LKE). Getting started is easy: sign up for a free Linode account and follow the LKE onboarding guide to create your cluster.
For this tutorial, I created a cluster consisting of two nodes (called Linodes), each with 2 CPU cores and 4 GB of memory as follows:

To work with the cluster, you need the cluster’s kubeconfig file, which you can download from the cluster overview section. There are several strategies you can use to merge the kubeconfig files. However, I prefer to update the KUBECONFIG environment variable with the path to the kubeconfig file.
Let’s now build a simple application that we will use to test the various autoscalers.
Pressure API
The Pressure API is a simple .NET REST API that allows you to apply CPU and memory pressure on the pod in which the application is running via its two endpoints:
- /memory/{numMegaBytes}/duration/{durationSec}: This endpoint will add the specified number of Megabytes to memory and maintain the pressure for the specified duration.
- /cpu/{threads}/duration/{durationSec}: This endpoint will run the specified number of threads on the CPU and maintain the pressure for the specified duration.
Following is the complete source code of the application:
using System.Xml;

var builder = WebApplication.CreateBuilder(args);

builder.Services.AddEndpointsApiExplorer();
builder.Services.AddSwaggerGen();

var app = builder.Build();

if (app.Environment.IsDevelopment())
{
    app.UseSwagger();
    app.UseSwaggerUI();
}

app.MapPost("/memory/{numMegaBytes}/duration/{durationSec}", (long numMegaBytes, int durationSec) =>
    {
        // ReSharper disable once CollectionNeverQueried.Local
        List<XmlNode> memList = new();

        try
        {
            while (GC.GetTotalMemory(false) <= numMegaBytes * 1000 * 1000)
            {
                XmlDocument doc = new();
                for (var i = 0; i < 1000000; i++)
                {
                    memList.Add(doc.CreateNode(XmlNodeType.Element, "node", string.Empty));
                }
            }
        }
        // Don't fail if memory is not available
        catch (OutOfMemoryException ex)
        {
            Console.WriteLine(ex);
        }

        Thread.Sleep(TimeSpan.FromSeconds(durationSec));
        memList.Clear();
        GC.Collect();
        GC.WaitForPendingFinalizers();
        return Results.Ok();
    })
    .WithName("LoadMemory");

app.MapPost("/cpu/{threads}/duration/{durationSec}", (int threads, int durationSec) =>
    {
        CancellationTokenSource cts = new();
        for (var counter = 0; counter < threads; counter++)
        {
            ThreadPool.QueueUserWorkItem(tokenIn =>
            {
#pragma warning disable CS8605 // Unboxing a possibly null value.
                var token = (CancellationToken)tokenIn;
#pragma warning restore CS8605 // Unboxing a possibly null value.
                while (!token.IsCancellationRequested)
                {
                }
            }, cts.Token);
        }

        Thread.Sleep(TimeSpan.FromSeconds(durationSec));
        cts.Cancel();
        Thread.Sleep(TimeSpan.FromSeconds(2));
        cts.Dispose();
        return Results.Ok();
    })
    .WithName("LoadCPU");


app.Run();
You don’t need to worry about the details of the application. I have published the container image of the application on GitHub Packages that you can use in your K8s specifications that we will build in the subsequent sections.
You can download the source code of the application and the other artifacts of this tutorial from the following GitHub repository:
The Kubernetes specs used in this tutorial are available in the spec folder of the code repository. Use the following spec to deploy the application to your LKE cluster:
apiVersion: apps/v1
kind: Deployment
metadata:
  name: pressure-api-deployment
spec:
  selector:
    matchLabels:
      app: pressure-api
  replicas: 1
  template:
    metadata:
      labels:
        app: pressure-api
    spec:
      containers:
        - name: pressure-api
          image: ghcr.io/rahulrai-in/dotnet-pressure-api:latest
          ports:
            - containerPort: 80
          resources:
            limits:
              cpu: 500m
              memory: 500Mi
---
apiVersion: v1
kind: Service
metadata:
  name: pressure-api-service
  labels:
    run: php-apache
spec:
  ports:
    - port: 80
  selector:
    app: pressure-api
Your application is now ready to accept requests but can be accessed only within the cluster. We will later use an ephemeral pod to send requests to our API. Let’s now discuss the most common autoscaler from the autoscaler family: Horizontal Pod Autoscaler (HPA).
Horizontal Pod Autoscaler (HPA)
Horizontal Pod Autoscaler allows you to dynamically adjust the number of pods in your cluster based on the current load. Kubernetes natively supports it with the HorizontalPodAutoscaler resource and controller bundled into the kube-controller-manager. The HPA relies on Kubernetes Metrics Server to provide the PodMetrics. The Metrics Server collects CPU and memory usage of the pods from the kubelets running on each node in the cluster and makes them available to the HPA through the Metrics API.
The following diagram illustrates the components involved in the process:

The Metrics Server polls the Summary API endpoint of the kubelet to collect the resource usage metrics of the containers running in the pods. The HPA controller polls the Metrics API endpoint of the Kubernetes API server every 15 seconds (by default), which it proxies to the Metrics Server. In addition, the HPA controller continuously watches the HorizontalPodAutoscaler resource, which maintains the autoscaler configurations. Next, the HPA controller updates the number of pods in the deployment (or other configured resource) to match the requirements based on the configurations. Finally, the Deployment controller responds to the change by updating the ReplicaSet, which changes the number of pods.
We know that the Metrics server is a prerequisite for HPA and VPA. Follow the instructions mentioned in the official Metrics Server guide to install it on your cluster. If you face TLS issues with the installation, use the metrics-server.yaml spec available in the spec folder of the code repo as follows:
kubectl apply -f spec/metrics-server.yaml
Let’s now configure the HorizontalPodAutoscaler object to scale out our deployment to five replicas and scale it down to one replica based on the average utilization of the memory resource as follows:
apiVersion: autoscaling/v2beta2
kind: HorizontalPodAutoscaler
metadata:
  name: pressure-api-hpa
spec:
  scaleTargetRef:
    apiVersion: apps/v1
    kind: Deployment
    name: pressure-api-deployment
  minReplicas: 1
  maxReplicas: 5
  metrics:
    - type: Resource
      resource:
        name: memory
        target:
          type: Utilization
          averageUtilization: 40
If the average utilization of the memory stays at over 40%, HPA will increase the replica count and vice versa. You can extend the rule to include CPU utilization as well. In this case, the HPA controller will determine the maximum number of replicas based on the combination of the rules and use the highest value.
Before we begin, let’s watch the HPA and the deployment in two different terminal windows to see the changes in the replica count in real-time.
kubectl get hpa pressure-api-hpa --watch

kubectl get deployment pressure-api-deployment --watch
To trigger the HPA, we will spin up an ephemeral pod and instruct it to send requests to the /memory/{numBytes}/duration/{durationSec} endpoint. The following command will trigger the HPA to scale up the pods to reduce the memory pressure.
kubectl run -i --tty mem-load-gen --rm --image=busybox --restart=Never -- /bin/sh -c "while sleep 0.01; do wget -q -O- --post-data= http://pressure-api-service/memory/1000/duration/180; done"
You can watch the HPA updating the replica count of the deployment in the terminal window. Note the growth of the active utilization against the target as follows:

Simultaneously, you can see the replicas getting updated as follows:

There are a few considerations to keep in mind when using HPA:
- Your application should be capable of sharing load among distinct instances.
- Your cluster should have sufficient capacity to accommodate the expansion of the number of pods. This can be addressed by provisioning the required capacity ahead of time and using alerts to prompt your platform operators to add more capacity to the cluster. You can also use cluster autoscaling to scale the cluster automatically. We will discuss this feature later in this tutorial.
- CPU and memory might not be the right metrics for your application to make scaling decisions. In such cases, you can use HPA (or VPA) with custom metrics as an alternative. To use custom metrics for autoscaling, you can use a custom metrics adapter instead of the Kubernetes Metrics Server. Popular custom metrics adapters are the Prometheus adapter and Kubernetes Event-Driven Autoscaler (KEDA).
Before we proceed, delete the HPA that you just created and reset the replica count of the deployment as follows:
kubectl delete hpa/pressure-api-hpa

kubectl scale --replicas=2 deployment/pressure-api-deployment
Let’s discuss another type of autoscaler available in Kubernetes: Vertical Pod Autoscaler (VPA).
Vertical Pod Autoscaler (VPA)
Vertical Pod Autoscaler allows you to adjust the resource capacity of a single instance dynamically. In the context of pods, this involves changing the amount of CPU and memory resources available to the pod. Unlike HPA, which is included in the core Kubernetes, the VPA requires you to install three controller components in addition to the Metrics Server. The following diagram illustrates Kubernetes components and their interactions with the VPA:

- Recommender: Determines the optimum CPU and memory values based on the usage of the pod resources.
- Admission plug-in: Mutates the pod’s resource requests and limits when the pod is created based on the Recommender’s recommendation.
- Updater: Evicts pods so that the admission plug-in intercepts its recreation request.
Follow the installation instructions in the ReadMe guide of VPA to prepare your cluster. Once the installation is complete, you can verify the health of the VPA components by running the following command:
kubectl get pods -l "app in (vpa-recommender,vpa-admission-controller,vpa-updater)" -n kube-system

Let’s understand how the VPA’s scaling operation works. The resource requests declarations in pod specification ensure that Kubernetes reserves the minimum required resources for the pod. When VPA detects that pods are close to their resource consumption limits, it will automatically compute a new, more appropriate set of values. If you define both the resource requests and the resource limits in the pod specification, VPA will maintain the request:limit ratio when updating the values. Thus whenever VPA updates the resource requests, it will also change the resource limits.
We’ll define a VPA policy to automatically adjust the CPU and memory requests without adding more pods to process workload as follows:
apiVersion: "autoscaling.k8s.io/v1"
kind: VerticalPodAutoscaler
metadata:
  name: pressure-api-vpa
spec:
  targetRef:
    apiVersion: "apps/v1"
    kind: Deployment
    name: pressure-api-deployment
  updatePolicy:
    updateMode: Recreate
  resourcePolicy:
    containerPolicies:
      - containerName: "*"
        minAllowed:
          cpu: 0m
          memory: 0Mi
        maxAllowed:
          cpu: 1
          memory: 2000Mi
        controlledResources: ["cpu", "memory"]
        controlledValues: RequestsAndLimits
The specification will apply to all containers of the deployment. The minimum and maximum threshold values will ensure that VPA operates within a reasonable range. The controlledResources field specifies the resources that will be autoscaled by the VPA.
The VPA supports four update modes. The Recreate and Auto modes are the only ones that activate autoscaling. However, there are limited use cases for these. The Initial mode will apply admission control to the set resource values when they are created, but it will prevent the Updater from evicting any pods. The most useful mode is the Off mode. In this mode, the VPA will not scale the resources. However, it will recommend the resource values. You can use this mode to compute the optimal resource values for your application during their comprehensive load testing and profiling before they go to production. The recommended values can be applied to the production deployment specification saving engineering toil.
Apply the previous specification and execute the following command to watch the autoscaler:
kubectl get vpa/pressure-api-vpa --watch
We will now apply CPU pressure using the following command to activate the VPA:
kubectl run -i --tty mem-load-gen --rm --image=busybox --restart=Never -- /bin/sh -c "while sleep 0.01; do wget -q -O- --post-data= http://pressure-api-service/cpu/10/duration/180; done"
After some time, execute the following command to view the recommendations produced by the VPA.
kubectl describe vpa/pressure-api-vpa
Following is a snipped output of the previous command that presents the recommendations from the VPA:

Use the Target value as a baseline recommendation for the CPU and memory requests. If the upper and lower bounds defined in the VPA spec are not optimal, use the Uncapped Target as the baseline, representing the target estimation produced with no minAllowed and maxAllowed restrictions.
Since we enabled vertical autoscaling, the newly created pods will have VPA annotations applied by the admission controller. The following command will display the annotations of the pod:
kubectl get pod <pod name> -o jsonpath='{.metadata.annotations}'
Here is the output of the previous command (from the K9s console):

Let’s delete the autoscaler and reset our deployment before moving to the next scaler in the list.
kubectl delete vpa/pressure-api-vpa
kubectl scale --replicas=1 deployment/pressure-api-deployment
Cluster Proportional Autoscaler (CPA)
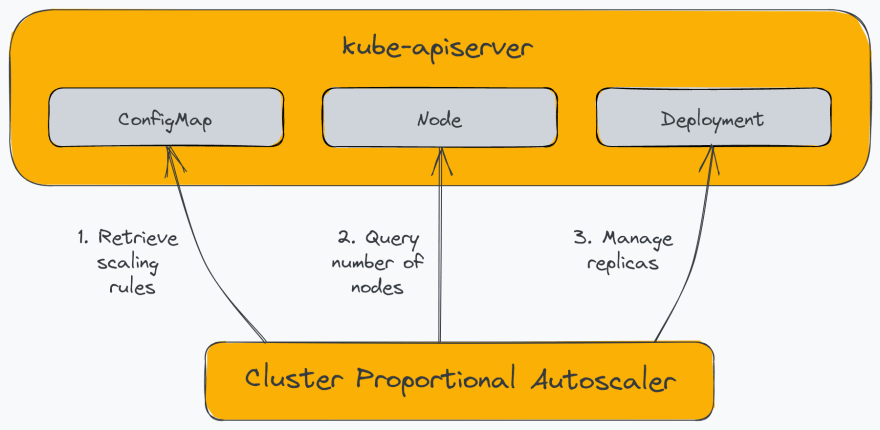
The Cluster Proportional Autoscaler (CPA) is a horizontal pod autoscaler that scales replicas based on the number of nodes in the cluster. Unlike other autoscalers, it does not rely on the Metrics API and does not require the Metrics Server. Additionally, unlike other autoscalers we saw, a CPA is not scaled with a Kubernetes resource but instead uses flags to identify target workloads and a ConfigMap for scaling configuration. The following diagram illustrates the components of the CPA:
CPA has relatively limited use cases. For example, CPA is generally used to scale-out platform services such as cluster DNS, which needs to scale with the workload deployed on the cluster. Another use case of CPA is to have a simple mechanism to scale out workloads since it does not require using Metrics Server or Prometheus Adapter.
You can install CPA on your cluster using its Helm chart. Use the following command to add the cluster-proportional-autoscaler Helm repo as follows:
helm repo add cluster-proportional-autoscaler https://kubernetes-sigs.github.io/cluster-proportional-autoscaler
helm repo update
You can define the autoscaling rules in the chart’s values file, which creates a ConfigMap with the specified configurations. You can later edit the ConfigMap to alter the behavior of the autoscaler without having to reinstall the chart.
Create a file named cpa-values.yaml and add the following content:
config:
  ladder:
    nodesToReplicas:
      - [1, 3]
      - [2, 5]
options:
  namespace: default
  target: "deployment/pressure-api-deployment"
You can specify one of the two scaling methods used by the CPA:
- Linear: Scales your application in direct proportion to how many nodes or cores are in the cluster.
- Ladder: Uses a step function to determine the ratio of nodes:replicas and/or cores:replicas.
In the above example, CPA will scale the deployment to three replicas if we have one node in the cluster and five replicas for two nodes. Let’s now install the chart and supply the configuration to it.
helm upgrade --install cluster-proportional-autoscaler \
    cluster-proportional-autoscaler/cluster-proportional-autoscaler --values cpa-values.yaml
As soon as you install CPA, you will find that it scales the pressure-api-deployment deployment to 5 replicas since our cluster has two nodes.
Let’s delete the CPA before moving to the next autoscaler in the list as follows:
helm delete cluster-proportional-autoscaler
We’ve looked at several approaches of autoscaling workloads using the core Kubernetes and community-built add-on components. Next, we will discuss how you can scale the Kubernetes cluster itself.
Cluster Autoscaler (CA)
Manually adding and removing capacity from the Kubernetes cluster can significantly drive up the cluster management costs and engineering toil. Cluster Autoscaler automates adding and removing worker nodes to the cluster to meet the desired capacity. CA works nicely in conjunction with the HPA. As soon as HPA starts approaching the compute resources limit, CA can calculate the number of nodes to satisfy the shortage and add new nodes to the cluster. Also, when CA determines that nodes have been underutilized for an extended period, it can reschedule the pods to other nodes and remove the underutilized nodes from the cluster.
The implementation of Cluster Autoscaler varies with the cloud providers. Some cloud providers such as Azure and AWS support Cluster API. Cluster API uses its Kubernetes operator to manage cluster infrastructure. The Cluster Autoscaler offloads the operation to update the node count to the Cluster API controller. Cluster autoscaling can be helpful if you consider the following before implementing it:
- Ensure that you understand how your application will behave under load and remove the bottlenecks that prevent the application from scaling horizontally.
- Know the upper scaling limit that the cloud provider might enforce.
- Understand the speed at which the cluster can scale when the need arises.
Enabling Cluster autoscaling on LKE is straightforward. First, navigate to the cluster overview page and click on the Autoscale Pool button.

Then, in the following dialog, enter the minimum and the maximum number of nodes that LKE should maintain as follows:

The LKE cluster autoscaler responds to Pending pods that couldn’t be scheduled due to insufficient compute resources. The autoscaler monitors the underutilized nodes and removes them from the cluster to scale down the cluster.
We started with a two-node cluster, each with two CPU cores and 4 GB of memory. To trigger the cluster autoscaler, we can add more replicas to our application as follows:
kubectl scale --replicas=15 deployment/pressure-api-deployment
After executing the command, you will find that several pods of the deployment reach the pending state as follows:

Soon afterward, LKE adds more nodes to the cluster and schedules some of them on the new nodes as follows:

You will find that some of the pods are still in the pending state because we instructed LKE to scale out to a maximum of four nodes. Finally, to clean up the environment, execute the following command:
kubectl delete deployment/pressure-api-deployment
Summary
We discussed the concept of horizontal autoscaling, vertical autoscaling, and cluster autoscaling, along with their use cases and considerations. If your applications are often subject to changes in capacity requirements, you can use HPA to scale them horizontally. VPA may help you to identify the optimal resource values for your applications. CPA can help you address the scaling requirements of applications that need to scale with the workload in the cluster. If your workloads can scale beyond the cluster’s capacity, use CA to autoscale the cluster itself. If you’re considering a managed Kubernetes service like LKE, look for a solution that has built-in autoscaling tools to reduce your effort.


Latest comments (1)
This is mostly pretty useful information, thank you. However, I would like to make a few points if I may be so bold. You emphasise that auto-scaling is primarily about saving costs and reducing engineering maintenance effort, and I would agree with that. But, perhaps more importantly, it is about ensuring that sufficient capacity is available to maintain the level of service expected by the business stakeholders and of course the customers of the application. It’s all very well shaving infrastructure costs but if by doing so you degrade the customer experience in terms of performance, availability or reliability, you are not going to be very popular. I’m sure you imply this but personally I think its worth calling it out explicitly since IMHO it is the primary driver. As you also hint, auto-scaling can be tricky to get right. All too often in the desire to reduce costs we can fall into the trap of constantly flip-flopping nodes and workloads. These are often disruptive events. In some cases I’ve seen, poorly configured auto-scaling ended up costing MORE because it was too sensitive or using the wrong metrics, and had the effect of constantly cycling nodes each of which had a minimum charge regardless of how long they were active. That also had knock-on effects to ETCD traffic and ultimately the reliability of the cluster. Just like any form of optimisation exercise it takes skill and a fair bit of time and experience to get right. One last point, I have found autoscaling especially challenging where a cluster is supporting highly diverse workloads and can lead to a change in thinking around cluster and workload organisation. As always, YMMV.