Hey perf guys, as you aware, in recent times I have been working on Kubernetes. Even I got my first certification in Kubernetes - CKAD. You can check it out how I cracked CKAD exam in my last blog post. Now I am test-driving Civo's Kube100 platform. From the knowledge I acquired from the CKAD exam helped me to implement k3s to run JMeter tests in Civo's Jub100. This blog post will guide you how to run JMeter tests in k3s Civo Kube100 platform.
Before we dive into JMeter, let me give you an overview about Civo and Kube100.
What is k3s?
k3s is a lightweight Kubernetes. It is a certified Kubernetes distribution built for IoT & Edge computing.
About Civo
Civo is a cloud hosting platform based out of UK. They primarily work on cloud and Kubernetes. Civo created world's first k3s-powered, managed Kubernetes service.
Using Civo, you can spin up Kubernetes cluster in couple minutes and make use of Civo's features from the dashboard.
Features such as node management, DDoS protection, custom firewalls, bandwidth pooling etc.
Right now, you can test-drive Civo's Kubernetes service using the beta program called Kube100. During the beta, you will get free credits of $70 per month.
Click here to join KUBE100 beta program
<!-- /wp:button -->
Prerequisites
Before we being seeing the implementation of JMeter in Kubernetes cluster, let us install the following prerequisites.
- Civo Account (free to join - if your application approved, you will get $70 per month in form of free credits)
- Civo CLI (optional)
-
kubectl
-
kubectlallows you to run commands against Kubernetes clusters.
-
-
Minikube (optional)
- if you want to play with single-node Kubernetes cluster in your laptop or VM
- Favorite command line tool
- I prefer Windows Terminal
Let us get started.
Creating Kubernetes Cluster in Civo
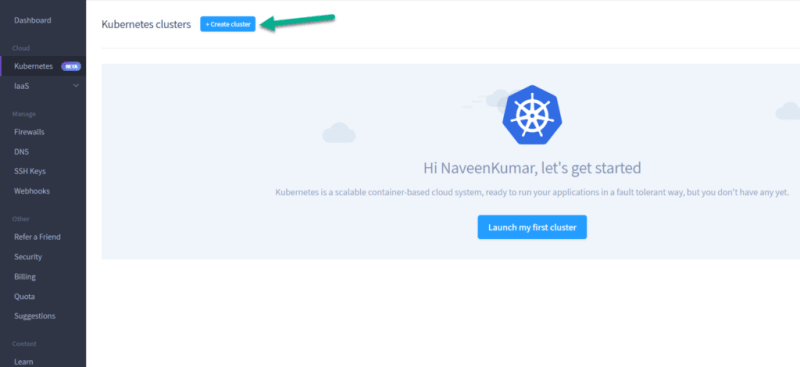
Login into your Civo account and click on Kubernetes and then click on Create cluster as shown below.
Enter the following as mentioned in the screenshot:
- Cluster name
- Node count
- Node size as Extra Small

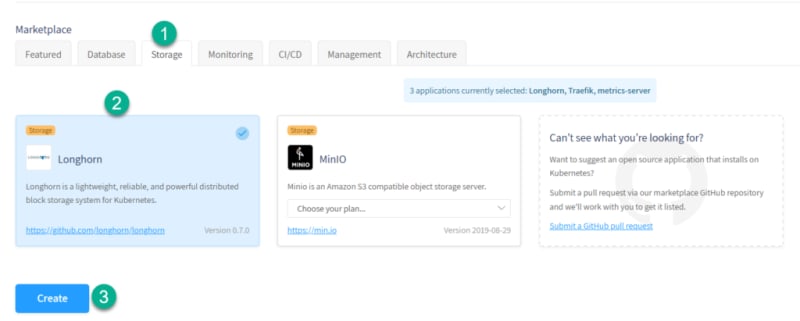
To store the JMeter results in the persistent volume, we will be using Rancher's Longhorn. It is available in the Civo's marketplace. Just scroll down a bit, click on Storage and then select Longhorn. Click on Create button to create the cluster.
Creating the cluster will take couple minutes or less. After successful creation, you need to download the Kubeconfig file as shown below.
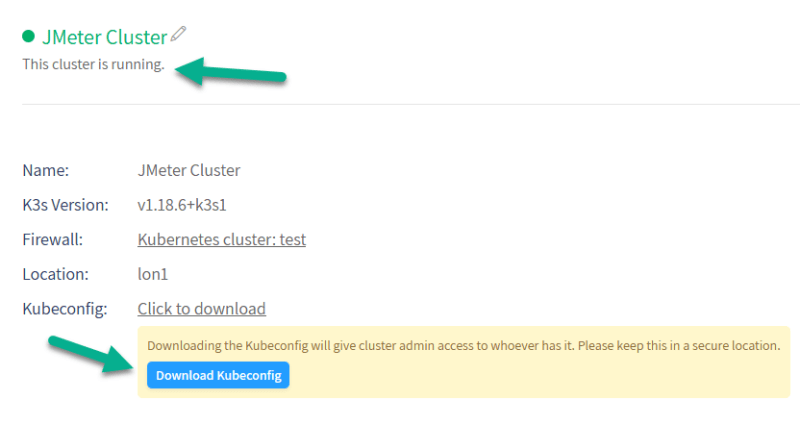
Store the Kubeconfig file in a secured location. It contains cluster admin credentials.
Accessing nodes using kubectl
Launch your favorite command line tool. I am using Windows Terminal. First step is to configure the Kubeconfig file, so that you can access the nodes.
Use the below command in Windows to configure the Kubeconfig.
setx KUBECONFIG 'C:\Tools\civo-0.6.19-windows-amd64\civo-jmeter-cluster-kubeconfig'

If you are in Linux, you can use the below command.
export KUBECONFIG="path_to_config_file"
Let us validate whether we can access the Kubernetes clusters or not by issuing the below command.
kubectl get nodes

Deploy Pods
Before we start creating pods for JMeter, we need to store the results of our tests to the persistent volume. Let us leverage Rancher's Longhorn which is available in the Civo marketplace.
Join Kube100 and receive $70 monthly free credits
<!-- /wp:button -->
Persistent Volume
First step is to create a persistent volume using the below yml. The name of the persistent volume is jmeter-pv. Copy the below yml config and save it to your local and apply the below command.
kubectl create -f .\pv.yml
apiVersion: v1
kind: PersistentVolume
metadata:
  name: jmeter-pv
  namespace: jmeter
  labels:
    name: jmeter-data
    type: longhorn
spec:
  capacity:
    storage: 1G
  volumeMode: Filesystem
  storageClassName: longhorn
  accessModes:
    - ReadWriteOnce
  csi:
    driver: io.rancher.longhorn
    fsType: ext4
    volumeAttributes:
      numberOfReplicates: '2'
      staleReplicaTimeout: '20'
    volumeHandle: jmeter-data
To validate the persistent volume, issue the below command.
kubectl get pv

Persistent Volume Claim
Next step is to claim the created volume to use it in the JMeter pod. To claim the persistent volume, copy the below yml and save it to your local and issue the below command.
kubectl create -f .\pvc.yml
apiVersion: v1
kind: PersistentVolumeClaim
metadata:
  name: jmeter-pv-claim
  labels:
    type: longhorn
    app: jmeter
spec:
  storageClassName: longhorn
  accessModes:
    - ReadWriteOnce
  resources:
    requests:
      storage: 1Gi
To validate the persistent volume claim, issue the below command and make sure the status is bound.
kubectl get pvc

JMeter Pod
To run our JMeter tests we are going to make use of the following image justb4/jmeter.
Copy the below yml and save it to your local and issue the below command to run the JMeter tests.
kubectl create -f .\jmeter-pod.yml
apiVersion: v1
kind: Pod
metadata:
  creationTimestamp: null
  labels:
    run: jmeter
  name: jmeter
spec:
  containers:
  - image: justb4/jmeter
    name: jmeter
    command: ["sh","-c","jmeter -n -t /opt/apache-jmeter-5.1.1/bin/examples/CSVSample.jmx -l /opt/results/mylog.log"]
    volumeMounts:
      - name:  jmeter-pv-claim
        mountPath:  "/opt/results"
  volumes:
  - name: jmeter-pv-claim
    persistentVolumeClaim:
      claimName: jmeter-pv-claim
  restartPolicy: Never
status: {}
Above pod configuration executes JMeter test plan which is located in the examples folder and then stores the results to the persistent volume in the path /opt/results.
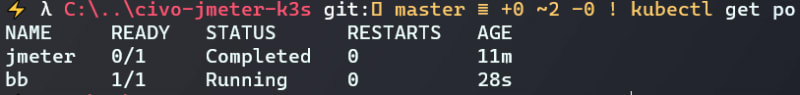
To validate the pod is running successfully or not, issue the below command.
kubectl get po
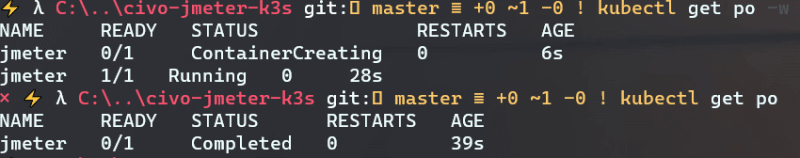
As you see in the above screenshot, jmeter pod ran successfully and completed the tasks.
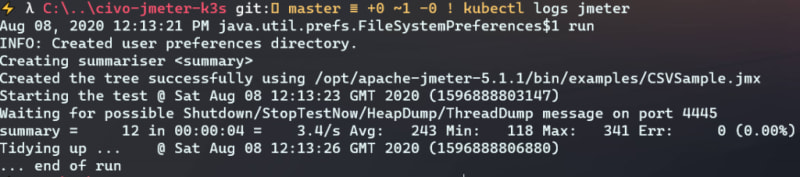
After the completion, you can view the logs of the pod by issuing the below command.
kubectl logs jmeter
Download the JMeter raw results
To view or download the JMeter results which are stored in /opt/results folder in the persistent storage, we are going to make use of busybox pod.
Copy the below yaml and save it to local and then issue the below command to create the pod.
kubectl create -f .\busybox.yml
apiVersion: v1
kind: Pod
metadata:
  labels:
    run: bb
  name: bb
spec:
  containers:
  - image: busybox
    name: bb
    command: ["sh","-c","sleep 3600"]
    volumeMounts:
      - name:  jmeter-pv-claim
        mountPath:  "/opt/results"
  volumes:
  - name: jmeter-pv-claim
    persistentVolumeClaim:
      claimName: jmeter-pv-claim
  restartPolicy: Never
To validate the pod, issue the below command. It should be Running status.
To validate whether the results are stored in the persistent volume we need to log in into the bb pod.
To login into the busybox pod, issue the below command.
kubectl exec bb -it -- sh
This will enable you to peek into the pod to run commands. Type cat /opt/results/mylog.log to view the raw results as shown below.

To come out of the bb pod, type exit command.
To copy the contents, issue the below command.
kubectl cp bb:/opt/results/mylog.log jmeter-results
This command will copy the log file and create a new folder jmeter-results in your local and paste the log file into it.
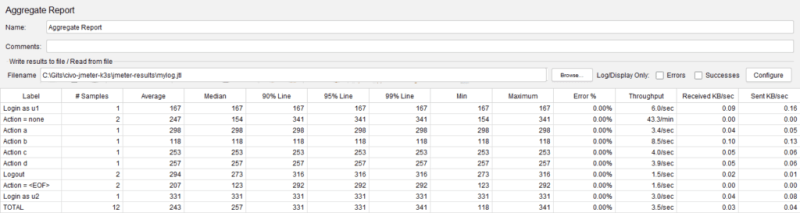
To view the results in JMeter, launch JMeter and add the desired listener and browse the results (make sure you change the extension to .jtl)
? Congratulations! You successfully completed running JMeter test plan in Kubernetes in Civo ?
What we have done is just the tip of the iceberg. You can run multiple pods or deployments to inject more load. Or you could integrate Grafana to view the stats instantly.
Points to note:
- If you use high power nodes, you can inject more threads by following JMeter best practices
- It is possible to leverage distributed load testing, I will work on that eventually
- By integrating with InfluxDB/Grafana/Prometheus, you will get the luxury of storing results for analysis
- Affordable pricing and ease of maintenance
All the yaml files are available in my GitHub repo. Please star and fork it.
<!-- /wp:button -->
Please let me know if you hit any road block, happy to help you out.


Latest comments (0)