As a part of my Learn JMeter Series in YouTube, I was working on JMeter Integration with InfluxDB and Grafana. During the study phase, I have learned few more insights about the integration. This blog post focuses on JMeter Integration with InfluxDB and Grafana using Docker. You can check my Prometheus Integration with JMeter in here.
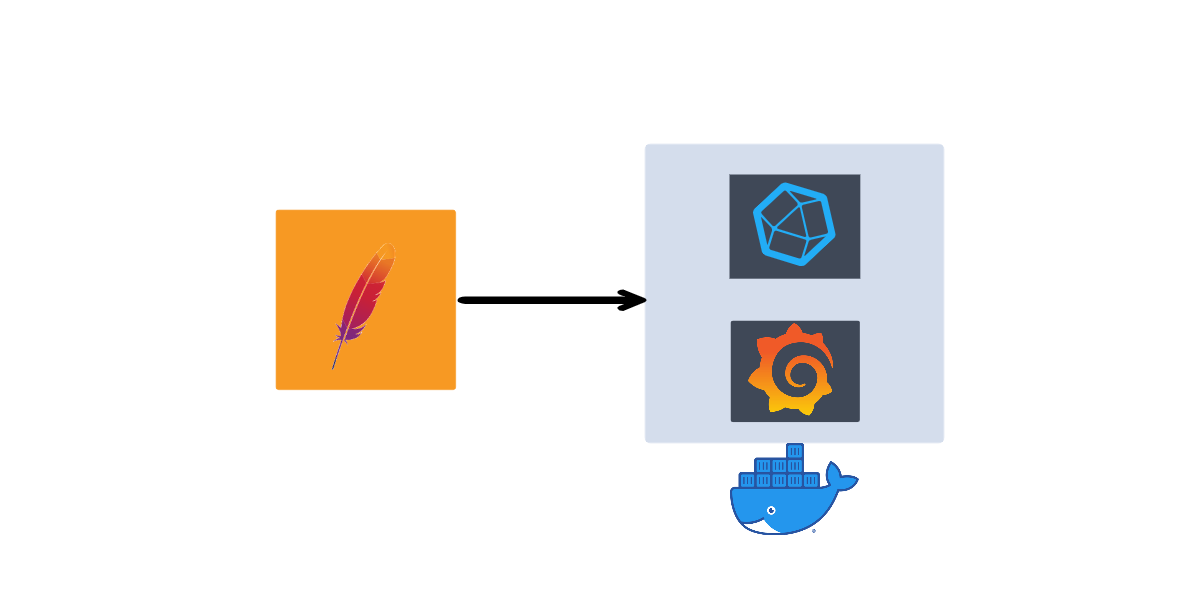
Before we get started, let us understand what each component is and its purpose. I have also created a simple diagram to understand the integration.
What is InfluxDB?
InfluxDB is an open-source time series database developed by InfluxData. It is written in Go and optimized for fast, high-availability storage and retrieval of time series data in fields such as operations monitoring, application metrics, Internet of Things sensor data, and real-time analytics.
from Wikipedia
What is Grafana?
Grafana is a multi-platform open source analytics and interactive visualization web application. It provides charts, graphs, and alerts for the web when connected to supported data sources, Grafana Enterprise version with additional capabilities is also available. It is expandable through a plug-in system.
from Wikipedia
What is Docker?
Docker is a set of platform as a service products that use OS-level virtualization to deliver software in packages called containers. Containers are isolated from one another and bundle their own software, libraries and configuration files; they can communicate with each other through well-defined channels.
from Wikipedia
Prerequisites
Following are the prerequisites required for the integration:
- Docker
- JMeter 5.4
- Sample JMeter Test Plan
This integration has been tested in Windows 10 Pro. But it should work in other OS using the similar commands.
Let's get started
Influx DB up and running in Docker
First let's start with InfluxDB setup in Docker. This integration uses the InfluxDB v1.8.3.
Download the InfluxDB 1.8.3 in here.
Extract the contents. We are just going to use the influxdb.conf file in our Docker container.
Open the terminal and run the below command to spin the InfluxDB container.
docker run -p 8000:8086 -d -v C:\Tools\influxdb-1.8.3_windows_amd64\influxdb-1.8.3-1:/var/lib/influxdb influxdb:1.8 -config /var/lib/influxdb/influxdb.confThen enter docker ps to see the running containers list. You will get the below output.
![]()
Launch http://localhost:8000 in your favor browser, you will get
404 page not found
That is fine. We are going to create a database by executing commands into the docker container.
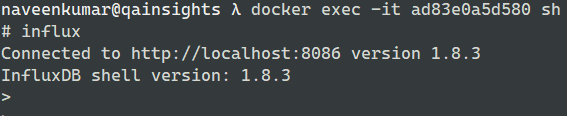
Enter the below command to execute sh into the running container.
docker exec -it <container-id> sh
After logging into the InfluxDB container, enter influx command which will logins into InfluxDB Shell as shown below.
Enter the below command to create a database called jmeter.
create database jmeter
Then, enter show databases command which will list out all the available databases.
Let us create an admin user for InfluxDB by entering the below command.
CREATE USER admin WITH PASSWORD 'admin123' WITH ALL PRIVILEGESType exit twice to come out of the container.
Grafana up and running
Creating Grafana container is straightforward. Enter the below command and hit enter.
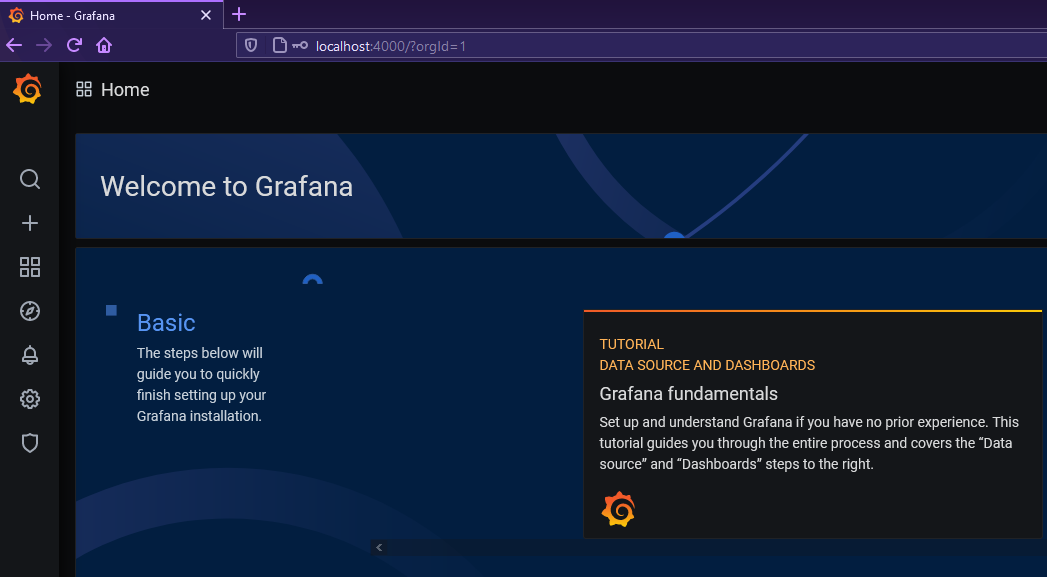
docker run -d --name=grafana -p 4000:3000 grafana/grafana
Launch http://localhost:4000 in your favorite browser. The default credential is admin and admin. Upon first time login, it will prompt you to change the password.
Hover over Settings icon, click on Data Sources to add our InfluxDB container.

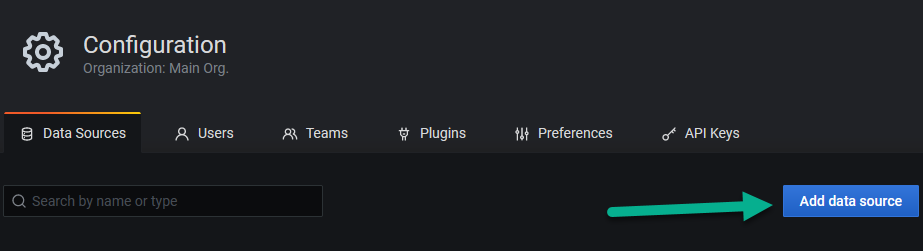
In Configuration, click on Add data source button and then select InfluxDB.
Fill the detailed as shown below.
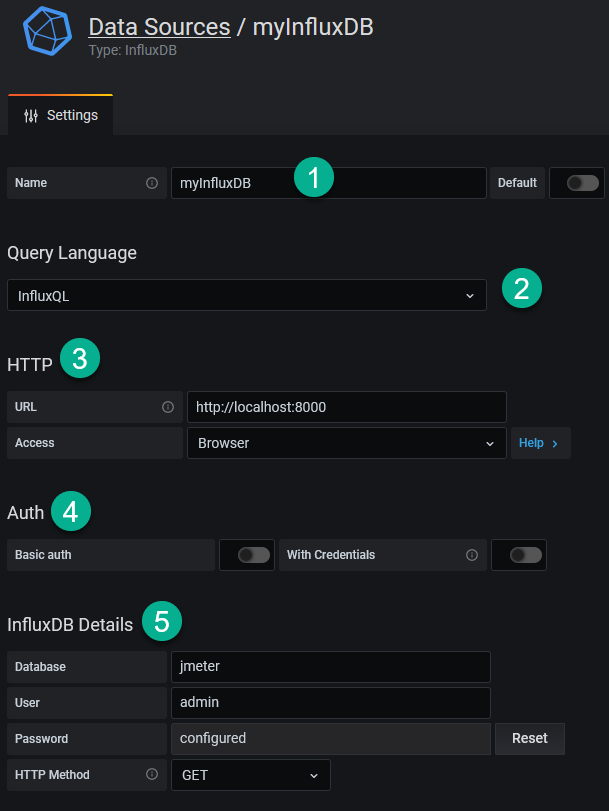
- Name of the connection
- Query Language as InfluxQL
- InfluxDB connection with the port and Access as Browser.
- Toggle off Auth options
- Enter database name, username, password and HTTP method as jmeter, admin, admin123, and GET respectively.
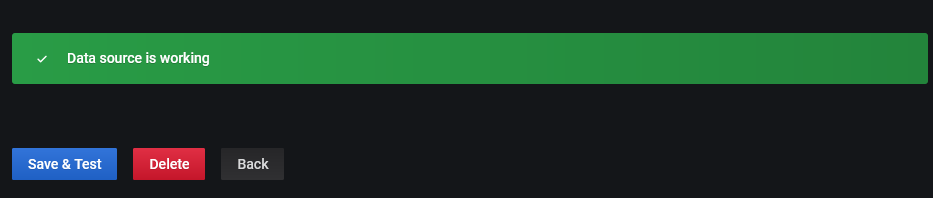
Click on Save & Test button. If everything goes well, you will success message Data source is working.
JMeter Test Plan Set up
Launch JMeter and open the test plan which you will be executing. Add a Backend Listener by right clicking on Thread Group > Add > Listener > Backend Listener.

Configure the listener as shown below.
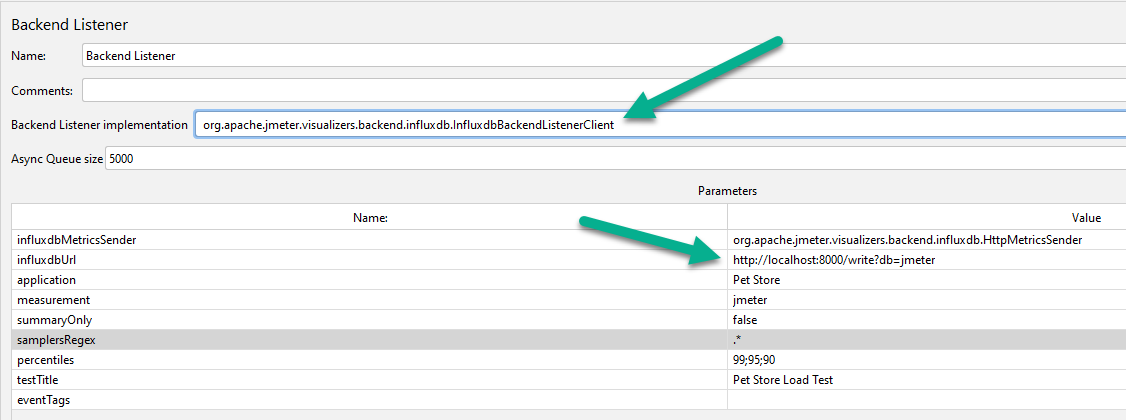
Make sure you selected the implementation as InfluxdbBackendListenerClient and influxdbMetricsSender as org.apache.jmeter.visualizers.backend.influxdb.HttpMetricsSender.
Save your test plan and start the test in CLI mode.
Navigate to Grafana > Explore, select the database and configure the query as shown below. You will get the performance stats realtime while the test is running.
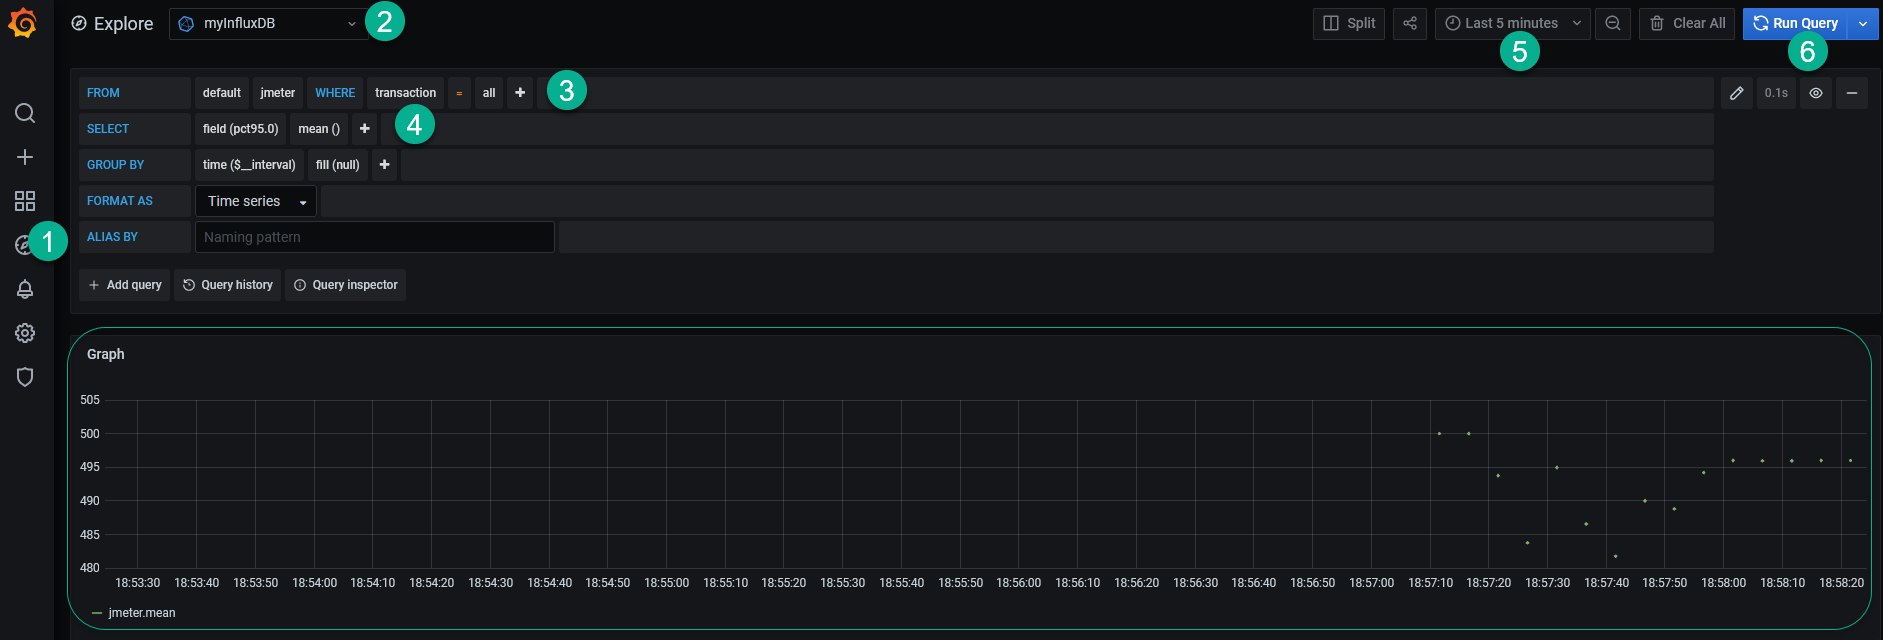
Here is the query to retrieve 95 percentile response time in Grafana.
SELECT mean("pct95.0") FROM "jmeter" WHERE ("transaction" = 'all') AND $timeFilter GROUP BY time($__interval) fill(null)
Now the integration is successful, you can start creating dashboards based on your needs.
Important Points:
- The default port of InfluxDB is 8086. As we are running it as docker container, I am exposing it at 8000.
- The containers of Grafana and InfluxDB are ephemeral. If you kill the containers, you will lose everything. You can persist the data by mounting the volume.
You can stop the container using docker container stop <container_id>.
You can remove the container using docker container rm <container_id>.
Final Words
The integration of InfluxDB and Grafana is pretty simple and straightforward. Running them in Docker containers is even easier. This integration helps us in monitoring the performance data in real time and also in taking the necessary steps while test is running.
You can set up the alerts, create dashboards, share dashboards, create powerful query and more in Grafana.


Top comments (0)