Overview
Welcome to the second part of this blog series on Microsoft Defender for DevOps.
In my previous post we looked at how you can integrate Defender for DevOps with GitHub and also how to use the Microsoft Security DevOps (MSDO) GitHub action to configure Terrascan to analyze a Terraform IaC Configuration and how the scan results are published on the Azure portal under the DevOps Security dashboard inside Microsoft Defender for Cloud.
Today we will look at how to integrate Defender for DevOps with Azure DevOps instead using the same MSDO toolkit.
Azure DevOps uses the Microsoft Security DevOps (MSDO) Marketplace Extension, instead of a GitHub action. So we will be able to use the same analysis tools on Azure DevOps as we did on GitHub as shown on the previous post.
We will also install another Azure DevOps Extension called SARIF SAST Scans Tab to better view the results of MSDO analyzer scans on Azure DevOps pipeline runs, outside of the console output and results file. It will look for *.sarif files in the CodeAnalysisLogs build artifact directory and display them as source annotations.
Microsoft Security DevOps (MSDO) Overview
Just to recap on what MSDO is, Microsoft Security DevOps (MSDO) is a command line application which integrates static analysis tools, for security and compliance into the development cycle.
MSDO installs, configures and runs the latest versions of static analysis tools. It is data-driven with portable configurations that enable deterministic execution across multiple environments.
The MSDO toolkit can output and convert results to Static Analysis Results Interchange Format (SARIF) which can display the results in your pipeline runs under a Scans tab using the SARIF SAST Scans Tab extension on Azure DevOps.
MSDO also integrates with Microsoft Defender for DevOps which enables a central console as part of Microsoft Defender for Cloud to provide security teams DevOps insights across multi-pipeline environments, such as GitHub and Azure DevOps.
These insights can then be correlated with other contextual cloud security intelligence to prioritise remediation in code and apply consistent security guardrails throughout the application lifecycle. The benefits of Defender for DevOps, available through Defender for Cloud are:
- Unified visibility into DevOps security posture.
- Visibility of rich security insights to help strengthen cloud resource configurations throughout the development lifecycle.
- Prioritise remediation of critical issues in code.
MSDO tools
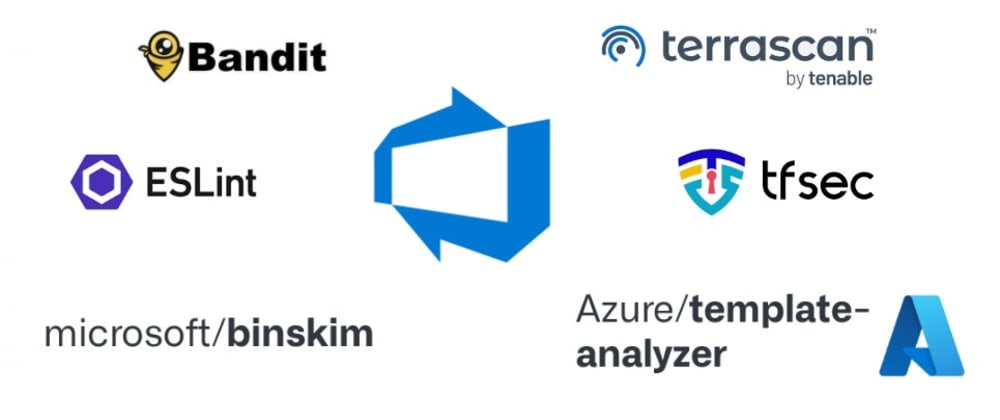
At the time of this writing, Microsoft Security DevOps uses the following tools:
| Name | Language | License |
|---|---|---|
| Bandit | Python | Apache License 2.0 |
| Binskim | Binary--Windows, ELF | MIT License |
| ESlint | JavaScript | MIT License |
| Credscan | A tool developed and maintained by Microsoft to identify credential leaks such as those in source code and configuration files common types: default passwords, SQL connection strings, Certificates with private keys | Free during Defender for DevOps preview |
| Template Analyzer | ARM templates, Bicep files | MIT License |
| Terrascan | Terraform (HCL2), Kubernetes (JSON/YAML), Helm v3, Kustomize, Dockerfiles, Cloud Formation | Apache License 2.0 |
| Trivy | Container images, File systems, Git repositories | Apache License 2.0 |
Getting started
Before we dive into the MSDO toolkit we first need to connect our Azure DevOps repository to Microsoft Defender for Cloud.
Log into the Azure portal.
Navigate to Microsoft Defender for Cloud > Environment Settings.
Select Add environment and then Select Azure DevOps.

Enter a name, select your subscription, resource group, and region.

Select Plans.

Select Next: Authorize connection and Authorize the Azure DevOps connection after reviewing the permission request.
 IMPORTANT: If your authorizing account is part of multiple Azure DevOps Organisations, ensure that you are logged into the correct org using: https://aex.dev.azure.com/
  You will also be able to verify your permissions to link Defender for DevOps to the correct Azure DevOps Org by looking at the top of the permission request screen before accepting.
After Authorizing, Select your relevant organization(s), project(s) and repository(s) from the drop-down menus.

Select Next: Review and create. Review the information and select Create.
After creation you will see the Azure DevOps connector under Microsoft Defender for Cloud > Environment Settings.

You will also see newly created service hooks in the selected Azure DevOps Project(s) where Defender for Devops have been onboarded.

With Defender for DevOps now connected on the selected Azure DevOps projects you want to onboard, they will be integrated with Microsoft Defender for Cloud and insights will be accessible from the DevOps Security dashboard under Microsoft Defender for Cloud in the Azure portal.

Next we will install the MSDO Azure DevOps Marketplace Extension.
Install required Devops extensions
Navigate to your Azure DevOps Org and install the following two Marketplace Extensions:
You can verify the installed extensions by navigating to the Shopping Bag Logo > Manage extensions in your DevOps Org.


Next we will look at how we can use the MSDO toolkit to populate the Defender for DevOps dashboard with rich security insights about our code.
Using the MSDO marketplace extension
As mentioned MSDO features a few different tools (I will cover some of the other tools in a future blog post), but I want to concentrate on the same tool as on the previous post called Terrascan.
Terrascan is a static code analyzer for Infrastructure as Code (IaC). Let's take a look at an example on how we can use MSDO integration with Defender for DevOps to get security insights and detect compliance and security violations in a Terraform configuration to mitigate risk before provisioning cloud infrastructure.
Let's look at an example. On my Azure DevOps repository I have a the following Terraform IaC configuration.

Next we'll configure a YAML pipeline to run the MSDO extension using a pipeline task that will trigger the Terrascan and Credscan analyzers to see if it can detect any issues on the Terraform configuration and check for any leaked secrets. We'll also look at how the results will be displayed on the pipeline run SARIF SAST Scan Tab.
Navigate to your Azure DevOps project and under pipelines, select New pipeline

Select Azure Repos Git.

Select the relevant repository.

Select Starter pipeline.

Paste and commit the following YAML into the pipeline, select Save and run:
# Starter pipeline
# Start with a minimal pipeline that you can customize to build and deploy your code.
# Add steps that build, run tests, deploy, and more:
# https://aka.ms/yaml
trigger: none

pool:
  vmImage: 'windows-latest'

steps:
  - checkout: self

  - task: UseDotNet@2
    displayName: 'Use dotnet 3.1.x'
    inputs:
      version: 3.1.x

  - task: UseDotNet@2
    displayName: 'Use dotnet 5.0.x'
    inputs:
      version: 5.0.x

  - task: UseDotNet@2
    displayName: 'Use dotnet 6.0.x'
    inputs:
      version: 6.0.x

  - task: MicrosoftSecurityDevOps@1
    displayName: 'Microsoft Security DevOps'
    inputs:
      categories: 'IaC,secrets'
      tools: 'terrascan'
Take a closer look at the MSDO task and notice that we supply certain inputs:
- task: MicrosoftSecurityDevOps@1
  displayName: 'Microsoft Security DevOps'
  inputs:
    categories: 'IaC,secrets'
    tools: 'terrascan'
At the time of writing the following inputs are supported:
| Input | Description | Default |
|---|---|---|
config: |
A file path to an MSDO configuration file (*.gdnconfig). See config file examples. |
- |
policy: |
The name of a well known Microsoft policy. If no configuration is provided, the policy may instruct MSDO what tools to run. Values: 'none', 'microsoft'
|
'microsoft' |
categories: |
A comma separated list of analyzer categories to run. Values: 'secrets', 'code', 'artifacts', 'IaC', 'containers'. Example: 'IaC,secrets'. |
Defaults to all. |
languages: |
A comma separated list of languages to analyze. Example: 'javascript,typescript'. |
Defaults to all. |
tools: |
A comma separated list of analyzer tools to run. Values: 'bandit', 'binskim', 'eslint', 'template-analyzer', 'terrascan', 'trivy'. |
detect |
break: |
Values: true/false, will fail this build step if any error level results are found. |
false |
publish: |
Values: true/false, will publish the output SARIF results file to the chosen pipeline artifact. |
true |
artifactName: |
The name of the pipeline artifact to publish the SARIF result file to. If default left as "CodeAnalysisLogs", it integrates with the SARIF Scans Tab viewing experience |
CodeAnalysisLogs |
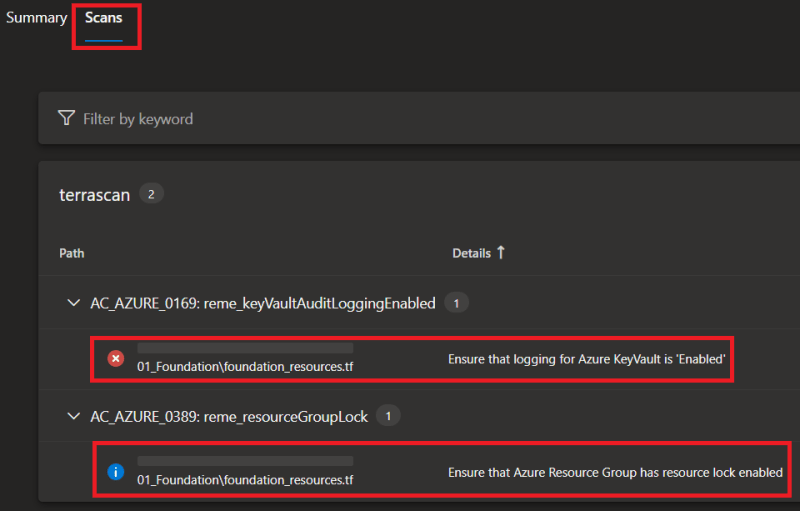
After running the pipeline, notice that there is a new Scans tab next to the pipeline run Summary (SARIF SAST Scan Tab). This tab is from the extension we installed earlier as the MSDO toolkit exports results into a *.sarif file and will be picked up in this tab.

Notice that the Terrascan results will be displayed in the Scans tab, based on the *.sarif file artifact.
You can also find the *.sarif file as an artifact attached to the pipeline run.


Defender for DevOps Dashboard
As mentioned MSDO closely integrates with Microsoft Defender for Cloud and has its own 'DevOps Security' dashboard, to review and observe security insights across DevOps and your codebase.
In the Azure portal navigate to Microsoft Defender for Cloud, select the DevOps Security pane and then click on the GitHub connector:

I hope you have enjoyed this post and have learned something new. You can find the code samples used in this blog post on my GitHub page. ❤️
Author
Like, share, follow me on: 🐙 GitHub | 🐧 Twitter | 👾 LinkedIn


Top comments (7)
Not even sure that this is the right place to give feedback, but I cannot find another place, so hoping Microsoft is listening :)
I've been playing a bit more and ran into another small issue. I got the following informational warning from my Terraform (that I can also see you also get in your screenshot):
Rule AC_AZURE_0389: Ensure that Azure Resource Group has resource lock enabledWhile this is easy to fix in Terraform, I want to disable this rule. As far as I can tell, it's not currently possible to disable rules when using the "Microsoft Security DevOps" extension. It is, however, possible to ignore policies in Terrascan that I believe is used behind the scene.
Why I want to disable this:
I'm sure there are other reasons why you would want to disable rules.
Again. Awesome that Microsoft is looking into this, as it's such an important area.
Came across this article when also refreshing my knowledge on Defender for DevOps... The pipeline integration isn't at all well documented, but I'd previously found through source trawling and FAQs that you can also just define pipeline variables if there's only a small amount of checks to skip:
e.g.,
GDN_TERRASCAN_SKIPRULES = AC_AZURE_0389
Ref: github.com/microsoft/security-devo...
Hey @tjementum
Thank you for the great feedback and as the product matures from preview I am sure that there will be exclusions that can be passed as inputs. But for the time being this is possible by using a (*.gdnconfig) config file: github.com/microsoft/security-devo...
You are looking for this setting:
"SkipRules": "",Example config for Terrascan using a gdconfig file:
I love it, thanks. I just configured this and got the following error:
The pipeline is not valid. Job Job: Step 'MicrosoftSecurityDevOps' references task 'MicrosoftSecurityDevOps' at version '1.6.0' contains an execution handler that relies on NodeJS version '6' which is restricted by your administrator.This is caused by this Azure DevOps organizational setting. I tried to disable that, and it works like a charm. But maybe you should consider upgrading to the latest version of NodeJS :)
That’s awesome, thanks for picking this up!
Hi Marcel
Thanks for this article it did help me a lot understanding more about this tool.
I have a question regarding the combination of the configuration options. I find it confusing regarding some combinations for categories and tools (and you can probably add languages to that). For instance, in your example you configure the tool to run "IaC, secrets", but specify "terrascan" as tool, I am assuming that the effect of that will be tha credscan will not run, so what is the point on specifying "secrets" in categories.
Maybe there is some kind of good purpose with these options, but it is simply hard for me to figure out because the documentation is not available.
Anyways thanks again.
\Jakub
Fantastic article. Question - when you run these pipelines, and they have issues, do you see these in the defender for devops UI in Azure. The results for me are not filtering through -wanted to confirm what you see
Some comments have been hidden by the post's author - find out more