Motivations
At Packmind, our PaaS provider CleverCloud offers many great features and add-ons to run Web apps. However, there are currently limitations for managing access logs and route them to an external system, such as an ELK stack. CleverCloud allows for draining server logs to Elasticsearch, but there's no parsing option, and our logs are considered a single string object.
We're interested in having access logs available to set up monitoring of our API and compute statistics on our traffic.
In this post, we're going to use Morgan, a request logger middleware for node.js to use in combination with Express, to create access logs, send them to an Elasticsearch database and visualize reports with Kibana. (Good news: with CleverCloud, we can deploy in a few seconds an Elasticsearch & Kibana!)
We're aware this schema goes against the 11th principle of the 12 factors app, but this is, according to us, a fair trade-off.
All the code of this post is available at the end of this post.
Setup Express and Morgan
Here is a basic setup of a node.js app that will be used for this tutorial. We're going to install Express, Morgan, and the logger framework Winston.
Let's first init the modules :
npm install --save express winston morgan
And this is how we can start an Express server with a logger writing on the standard output and use Morgan to log all the incoming requests.
const express = require('express');
const http = require('http');
const morgan = require('morgan');
const winston = require('winston');

const logger = winston.createLogger({
    transports: [
        new winston.transports.Console({
            level: 'info',
            json: true
        })
    ]
});

function startServer() {
    const app = express();
    app.use(morgan('combined'));

    app.get('/', (req, res) => {
        logger.info("Hi there !");
        res.status(200).json({});
    });

    const server = http.createServer(app);

    server.listen(3001, () => {
        logger.info("Server listens on 3001");
    });
}

startServer();
.
Also, the Morgan ('combined') format is the standard Apache combined log output, but we will change it in the following steps.
To make sure everything is ready, if you run your server, and ping http://localhost:3001, you'll see those logs in your terminal :
> node index.js

{"level":"info","message":"Server listens on 3001"}
::1 - - [08/Oct/2021:10:03:26 +0000] "GET / HTTP/1.1" 304 - "-" "Mozilla/5.0 (X11; Linux x86_64) AppleWebKit/537.36 (KHTML, like Gecko) Chrome/87.0.4280.141 Safari/537.36"
Note that Morgan generates the last line because of the incoming query.
Create our custom logger with Morgan
With Morgan, we can create a custom format to log our queries. As we're going to store our logs into an Elasticsearch database, we want to build our access logs in JSON format.
The documentation of Morgan provides more details on which properties can be retrieved. In this example, we compute a JSON object that will be stringified and containing basic properties for access logs :
const morganJSONFormat = () => JSON.stringify({
        method: ':method',
        url: ':url',
        http_version: ':http-version',
        remote_addr: ':remote-addr',
        response_time: ':response-time',
        status: ':status',
        content_length: ':res[content-length]',
        timestamp: ':date[iso]',
        user_agent: ':user-agent',
    });
app.use(morgan(morganJSONFormat()));
If you run now your server and ping it, you'll get the following log in your terminal :
{"method":"GET","url":"/","http_version":"1.1","remote_addr":"::1","response_time":"6.822","status":"304","content_length":"-","timestamp":"2021-10-08T10:04:55.197Z","user_agent":"Mozilla/5.0 (X11; Linux x86_64) AppleWebKit/537.36 (KHTML, like Gecko) Chrome/87.0.4280.141 Safari/537.36"}
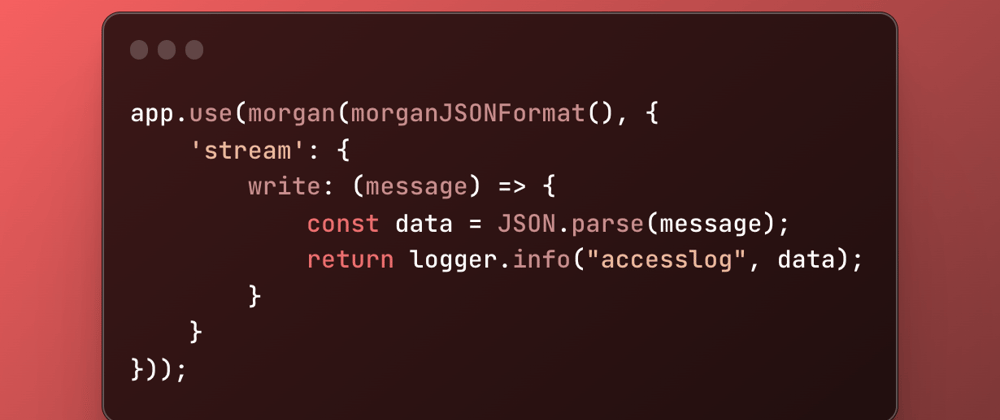
But as you can see, we don't use our Winston logger yet. This is written only in the standard output. We need to configure morgan for that :
app.use(morgan(morganJSONFormat(), {
    'stream': {
        write: (message) => {
            const data = JSON.parse(message);
            return logger.info("accesslog", data);
        }
    }
}));
And now we have proper access logs :
{"content_length":"-","http_version":"1.1","level":"info","message":"accesslog","method":"GET","remote_addr":"::1","response_time":"3.736","status":"304","timestamp":"2021-10-08T10:22:56.767Z","url":"/","user_agent":"Mozilla/5.0 (X11; Linux x86_64) AppleWebKit/537.36 (KHTML, like Gecko) Chrome/87.0.4280.141 Safari/537.36"}
Tip #1: User-Agent Parsing
If you have already worked with user agents, you probably know how they're not easy to understand. Consider this example:
"Mozilla/5.0 (X11; Linux x86_64) AppleWebKit/537.36 (KHTML, like Gecko) Chrome/87.0.4280.141 Safari/537.36".
See what I mean? ;-)
Fortunately, the npm package ua-parser-js comes to the rescue! Thanks to this library, our complex user agent can be translated into an object with properties that we can easily understand.
npm install --save ua-parser-js
In this version, we add four more properties to catch the browser name and version, in addition to the os name, and version :
//At the top of the file
const userAgentParser = require('ua-parser-js');
//...
app.use(morgan(morganJSONFormat(), {
    'stream': {
        write: (message) => {
            const data = JSON.parse(message);
            parseUserAgent(data); //Enrich data
            return logger.info("accesslog", data);
        }
    }
}));

function parseUserAgent(data) {
    if (data.user_agent) {
        const ua = userAgentParser(data.user_agent);
        if (ua.browser) {
            data.user_agent_browser_name = ua.browser.name;
            data.user_agent_browser_version = ua.browser.major || ua.browser.version;
        }
        if (ua.os) {
            data.user_agent_os_name = ua.os.name;
            data.user_agent_os_version = ua.os.version;
        }
    }
}
Tip #2: Sanitize the URL
Depending on how you designed your API, you may use identifiers in URL, like /api/product/:id, where :id is the identifier of your product. In this context, you're likely to receive calls like this :
/api/product/10
/api/product/101
/api/product/1001
However, you would like to gather all these routes under a single one /api/product/:id for a monitoring purpose.
Here is a simple example of how to sanitize your URL :
app.use(morgan(morganJSONFormat(), {
    'stream': {
        write: (message) => {
            const data = JSON.parse(message);
            parseUserAgent(data);
            sanitizeUrl(data);
            return logger.info("accesslog", data);
        }
    }
}));

function sanitizeUrl(data) {
    if (!data.url) {
        return;
    }
    const regex = /\/[0-9]+/g; //Adapt to your context
    const urlWithoutParameter = data.url.replace(regex, '/:id');
    data.url_sanitized = urlWithoutParameter;
}
Tip #3: Get remote ip when running behind a proxy
If your API is called behind an Nginx or any proxy, you may encounter issues with the remote_addr attribute since you will not get the original source IP, but your proxy's one. Don't worry, if the configuration of your proxy allows that, you can just use the request header X-Forwarded-For to access this information. That's why updated the code in this way :
const morganJSONFormat = () => JSON.stringify({
        method: ':method',
        url: ':url',
        http_version: ':http-version',
        remote_addr: ':remote-addr',
        remote_addr_forwarded: ':req[x-forwarded-for]', //Get a specific header
        response_time: ':response-time',
        status: ':status',
        content_length: ':res[content-length]',
        timestamp: ':date[iso]',
        user_agent: ':user-agent',
    });
Send logs to Elasticsearch
For this step, another npm module will come to the rescue, winston-elasticsearch. This module provides a Winston transport for Elasticsearch. We need to update our code to include a new transporter for our logger :
const winstonElasticsearch = require('winston-elasticsearch');
//...
const esTransportOpts = {
    level: 'info',
    indexPrefix: 'logging-api',
    indexSuffixPattern: 'YYYY-MM-DD',
    clientOpts : {
        node: process.env.ES_ADDON_URI,
        maxRetries: 5,
        requestTimeout: 10000,
        sniffOnStart: false,
        auth: {
            username: process.env.ES_ADDON_USER,
            password: process.env.ES_ADDON_PASSWORD
        }
    },
    source: process.env.LOG_SOURCE || 'api'
};
const esTransport = new winstonElasticsearch.ElasticsearchTransport(esTransportOpts);

const logger = winston.createLogger({
    transports: [
        new winston.transports.Console({
            level: 'info',
            json: true
        }),
        esTransport //Add es transport
    ]
});
Note that the clientOpts will depend on your configuration. You may not need it if you have no authentication, for instance.
The result
That's it!
After configuring your indexes in Kibana, you can now visualize your logs :
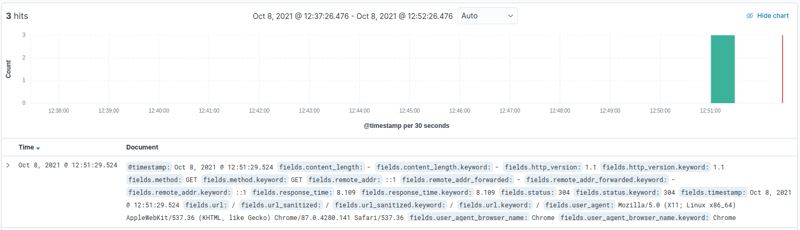
The final version of the code is available publicly on a Github repository if you want to take a look!


Top comments (0)