After publishing the post Oracle Database monitoring with Grafana Hozefa Palitanawala made me aware of one his projects inside Oracle: Oracle Enterprise Manager App for Grafana and how similar in a way was to what I was trying to do using the Oracle_Exporter for Prometheus and Grafana
Like I always say, the best way to know about something is to test it yourself :)

On this post we are going to see an Introduction of the App, we will do the Grafana and App installation using Docker-compose, Enable it as a Grafana Datasource, a brief introduction to the Sample Dashboards and mention just couple of things you can also do thanks to the app and OEM/Grafana Integration.
- Introduction
- Grafana and Oracle Enterprise Manager App Installation
- Enabling Oracle Enterprise Manager App for Grafana as a Data Source
- Dashboards Overview
- What else can you do?
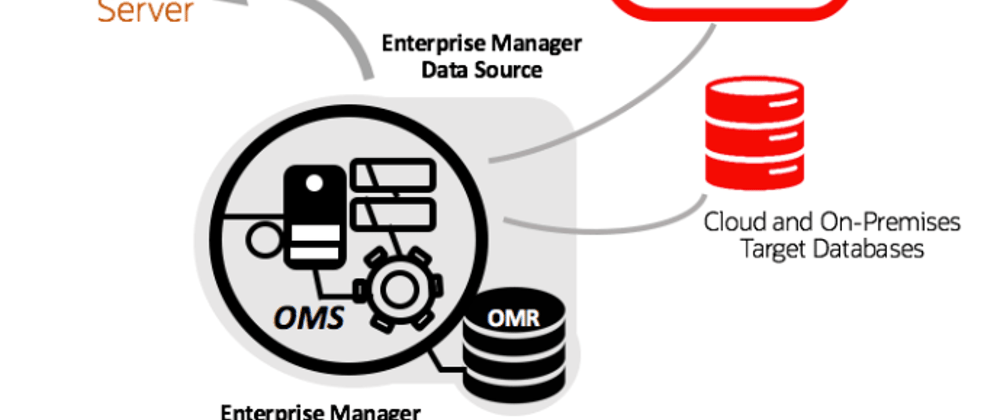
Introduction
I really didn't know about it and is not even so new, but this is one of the things you can have with Oracle, the number of products and applications is so bast, that is difficult to keep up with everything. At the same time, that is why you can have almost anything that will fit with your systems and projects, you just need to make sure to get in touch with the correct people to make sure you are not missing anything.
The introduction of the Application was done around June 2020 like you can read on this Oracle Post by Murtaza Husain - Introducing the brand new Oracle Enterprise Manager App for Grafana
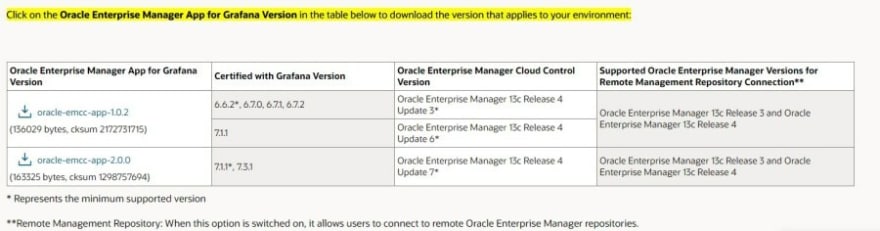
Important to remember is that you have different versions depending on you OEM version, so make sure you get the correct one from here:
Oracle Enterprise Manager App for Grafana
If your OEM dont match any of those version, you can check this post on How to Update OEM to 13c Release 4
Grafana and Oracle Enterprise Manager App Installation
I have created a github repository for a docker-compose installation type, but the installation using just docker or any other method is quiet simple as you can see in the Oracle Enterprise Manager App for Grafana Documentation
If you want to use my example, just clone the Grafana_OEM_APP repository
|=| oem13 in ~/ ○ → git clone https://github.com/Project-42/Grafana_OEM_APP.git
Cloning into 'Grafana_OEM_APP'...
remote: Enumerating objects: 33, done.
remote: Counting objects: 100% (33/33), done.
remote: Compressing objects: 100% (24/24), done.
Unpacking objects: 100% (33/33), done.
remote: Total 33 (delta 8), reused 27 (delta 4), pack-reused 0
You should end up with the following files/directories:
|=| oem13 in ~/Grafana_OEM_APP ± |master ✓| → tree
.
├── docker-compose.yml
├── plugins
│   └── LEAVE_Oracle_Enterprise_Manager_App_HERE.txt
└── README.md
The docker compose playbook is quite simple, just enough to make grafana to run as root since is the user I use for running the container (I should change that in the future, I know :) ), set the admin password and make docker to install Oracle Enterprise Manager App for Grafana plugin directly (but you will need to enable it after)
version: '3.4'
services:
  grafana:
    image: grafana/grafana:latest
    container_name: grafana_oem_app
    volumes:
      - ./plugins:/var/lib/grafana/plugins
    user: "0"
    environment:
      - GF_SECURITY_ADMIN_USER=admin
      - GF_SECURITY_ADMIN_PASSWORD=Welcome1
      - GF_INSTALL_PLUGINS=/var/lib/grafana/plugins/oracle-emcc-app-2.0.0.zip;oracle-emcc-app
    restart: unless-stopped
    ports:
      - 3000:3000
Download Oracle Enterprise Manager App for Grafana
Since Im using Grafana 7.x and OEM 13.4.0.9, I'm using oracle-emcc-app-2.0.0 for this example.
Move the zip file to the plugins folder to get something just like this:
|=| oem13 in ~/Grafana_OEM_APP ± |master ✓| →  tree
.
├── docker-compose.yml
├── plugins
│   ├── LEAVE_Oracle_Enterprise_Manager_App_HERE.txt
│   └── oracle-emcc-app-2.0.0.zip   <<<<<<<<<<<
└── README.md
Since we have our playbook and plugin ready, we can start Grafana using docker-compose as follow
|=| oem13 in ~/Grafana_OEM_APP ± |master ✓| → docker-compose up -d
Building with native build. Learn about native build in Compose here: https://docs.docker.com/go/compose-native-build/
Starting grafana_oem_app ... done

|=| oem13 in ~/Grafana_OEM_APP ± |master ✓| →
Enabling Oracle Enterprise Manager App for Grafana as a Data Source
Now that we have Grafana Installation complete, including the Application as a plugin, we can start using is as a Data Source.
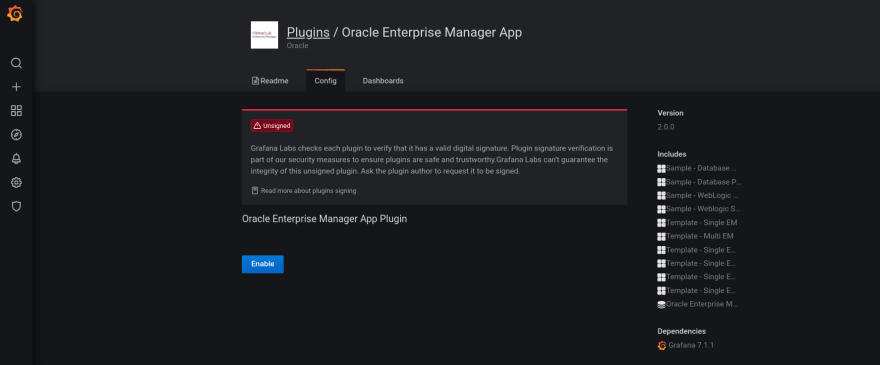
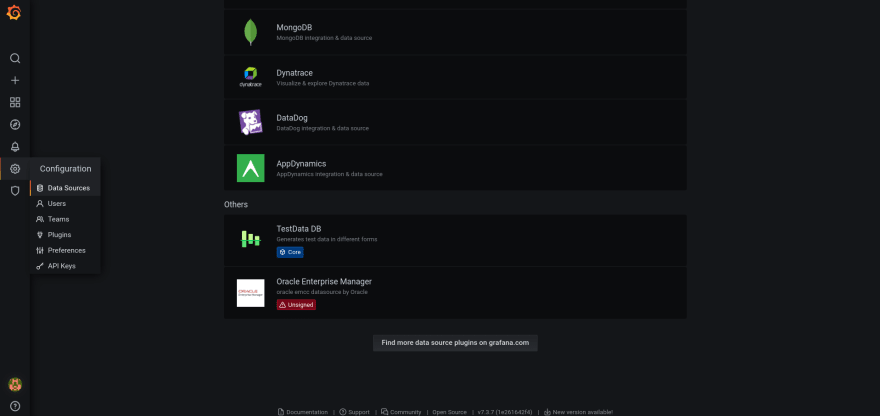
Login into Grafana you should be able to see the plugin in your Grafana plugin list
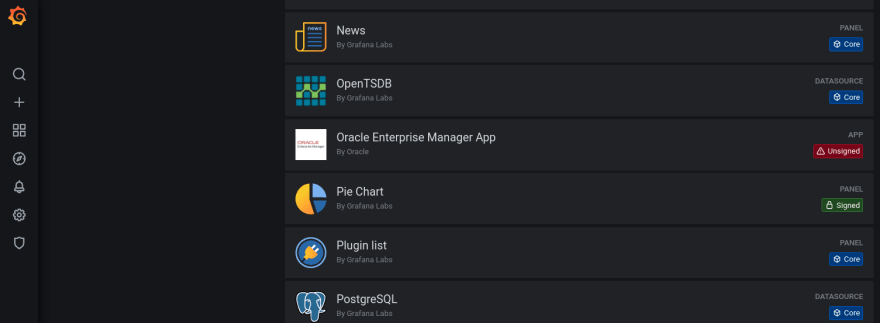
You have probably noticed the "Unsigned" tag for this plugin. The only reason we see this, is because we are using a Plugin that has not been downloaded directly from Grafana Owned repositories - Grafana Labs, nothing else
Let's now enable the following Grafana properties in OMS (remember to use OMS user owner) as mentioned in the documentation.
If you don't do that, OEM as Grafana Data Source won't be able to work
[oracle@oem13 ~]# $OMS_HOME/bin/emctl set property -name oracle.sysman.db.restfulapi.grafana.enable -value true -sysman_pwd Welcome1
Oracle Enterprise Manager Cloud Control 13c Release 4
Copyright (c) 1996, 2020 Oracle Corporation.  All rights reserved.
Property oracle.sysman.db.restfulapi.grafana.enable has been set to value true for all Management Servers
OMS restart is not required to reflect the new property value

[oracle@oem13 ~]# $OMS_HOME/bin/emctl set property -name oracle.sysman.db.restfulapi.grafana.executesql.repository.query.enable -value true -sysman_pwd Welcome1
Oracle Enterprise Manager Cloud Control 13c Release 4
Copyright (c) 1996, 2020 Oracle Corporation.  All rights reserved.
Property oracle.sysman.db.restfulapi.grafana.executesql.repository.query.enable has been set to value true for all Management Servers
OMS restart is not required to reflect the new property value

[oracle@oem13 ~]# $OMS_HOME/bin/emctl set property -name oracle.sysman.db.restfulapi.grafana.executesql.target.query.enable -value true -sysman_pwd Welcome1
Oracle Enterprise Manager Cloud Control 13c Release 4
Copyright (c) 1996, 2020 Oracle Corporation.  All rights reserved.
Property oracle.sysman.db.restfulapi.grafana.executesql.target.query.enable has been set to value true for all Management Servers
OMS restart is not required to reflect the new property value
[oracle@oem13 ~]#
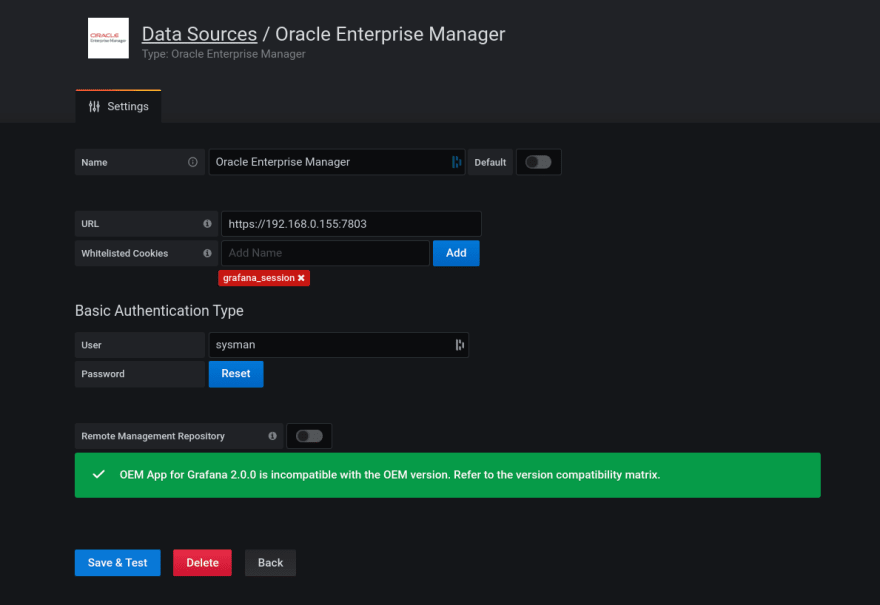
Let's enable the new Datasource, so go to Configuration -> Datasource and select the datasource Oracle Enterprise Manager
Set the OEM URL (avoid the final slash at the end) and user/password

Be aware that if you have a Not Supported OEM version, you will face the following error when trying to get the Datasource Enabled:
Dashboards Overview
Now that we have Enabled the new Datasource, you should now be able to see the Sample Dashboards coming with the App/Plugin:
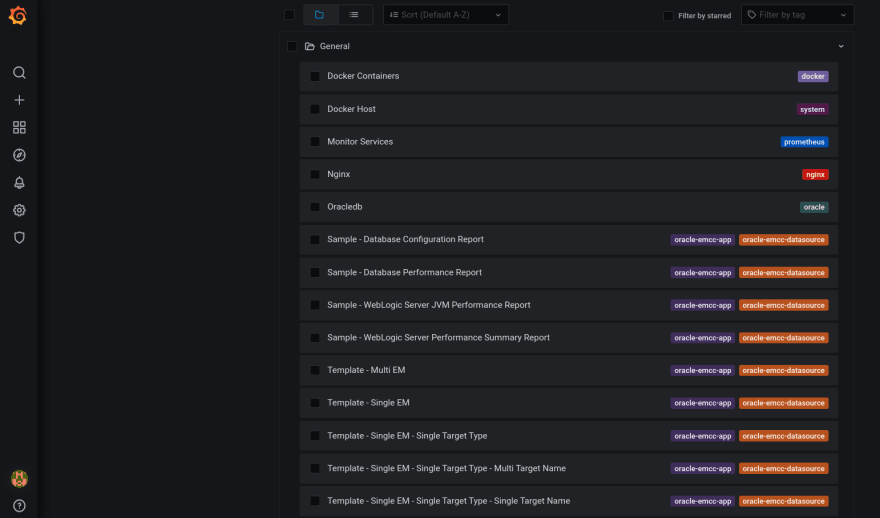
I recommend you to watch Monitor DB Performance & Configuration Metrics Using OEM App for Grafana Out-of-the-box Dashboards video for more info about them and get better understanding of what you can use them for
Monitor DB Performance & Configuration Metrics Using OEM App for Grafana Out-of-the-box Dashboards
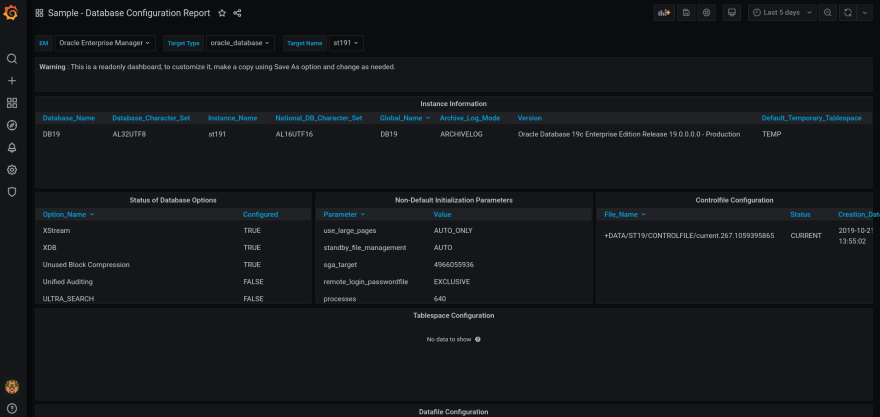
Like you see below, you should be able to see your targets details with them:

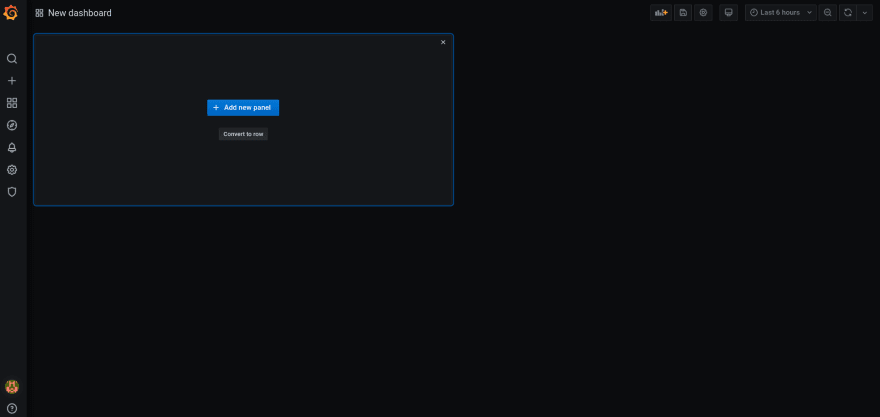
Let's create a custom Dashboard. Press the "+" sign and select Dashboard. Once there, you just click in Add new Panel
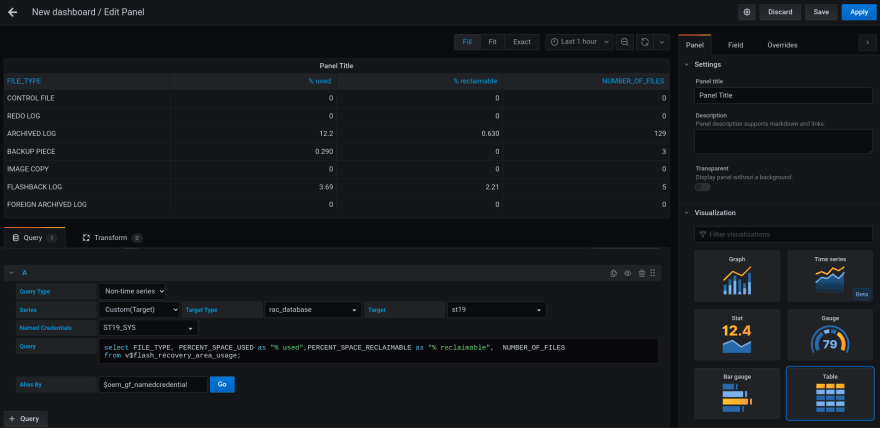
In the new panel, you just need to select "Oracle Enterprise Manager" and select the different fields for your new query.
If everything is set correctly, you just need click and select the different elements of the query, so you don't have to remember things like metric type or even the targets names.
This example, I created a Table with the Current ST19 Database FRA utilisation
What else can you do?
This post is just scratching the surface of all the possibilities you have with this App integrating your OEM with Grafana.
There is much more you can do and without spending much time building up your Grafana expertise thanks to the Dashboards included.
I mentioned one of the Database Dashboards included, but what about all those Weblogic systems? there is a Dashboard for it.
And what about Consolidating the different OEMs you have in your organisation? nobody likes to be jumping from one place to another try, so why not get all the information stats and graphics in one place? also possible!
Checkout the following Video and Article:
Monitor EM Metrics for WebLogic Server with Oracle EM App for Grafana
Hope this helps to give some boost to this brilliant plugin and make people to work with it.
Thanks again to Hozefa for his help!!


Top comments (0)