Easy Debugging with Developer Dashboard in SharePoint
As we know writing code for SharePoint sites is not difficult. Whether we are writing server side or client-side code for customizing features. The main point where everyone gets struck is troubleshooting or handling errors related to code. Also, error logging for SharePoint sites is done to both ULS and Windows Event Logs and finding or reading logs sometimes is really a mess. As, reading ULS (SharePoint Unified Logging Service) is not easy for everyone to get through. So, a new feature was introduced in SharePoint 2010 named Developer Dashboard.
What is developer dashboard?
Developer Dashboard is introduced as a new feature in SharePoint 2010. It’s an user interface which reflects useful diagnostic information. Developer dashboards are helpful to not only developers in debugging but also to administrator in handling issues related to farm.
Developer Dashboard gives the information about performance of controls used of a SharePoint page. Also, it tells about execution time taken by each control, log correlation ID, critical events, database queries with their handling time, service calls, SPRequests allocation whether used nominal or not and webparts event offsets (time taken in loading and rendering of webparts).
This is a very helpful performance tuning feature. By default, this feature is disabled. We may enable it by
- Powershell script
- STSADM command
using code
Enable developer dashboard SharePoint 2016/2013 using PowerShell script
We may easily enable or disable developer dashboard in SharePoint using PowerShell script as belows :-
Enable Developer Dashboard SharePoint:
$var = Microsoft.SharePoint.Administration.SPWebService]::ContentService.DeveloperDashboardSettings; $var.DisplayLevel = [Microsoft.SharePoint.Administration.SPDeveloperDashboardLevel]::On $var.Update()
Enable on Demand:
$var.DisplayLevel = ‘OnDemand’; Display level for Developer dashboard can also be set as 'OnDemand'.
Disable Developer Dashboard SharePoint:
$var = Microsoft.SharePoint.Administration.SPWebService]::ContentService.DeveloperDashboardSettings; $var.DisplayLevel = [Microsoft.SharePoint.Administration.SPDeveloperDashboardLevel]::Off $var.Update()
Just and On/Off and it can be enabled or disabled.
Enable developer dashboard SharePoint 2010 STSADM
Below is the STSADM command to enable or disable developer dashboard in SharePoint.
Enable Developer Dashboard SharePoint:
stsadm -o setproperty -pn developer-dashboard -pv on
Disable Developer Dashboard
stsadm -o setproperty -pn developer-dashboard -pv off
Enable on Demand (Recommended approach will be OnDemand):
stsadm -o setproperty -pn developer-dashboard -pv OnDemand
Enable developer dashboard SharePoint using Server Object Model
By using SharePoint server object model, we may do the enable or disable developer dashboard in SharePoint as belows:-
using Microsoft.SharePoint;
using Microsoft.SharePoint.Administration;
SPDeveloperDashboardSettings settings = SPWebService.ContentService.DeveloperDashboardSettings;
settings.DisplayLevel = SPDeveloperDashboardLevel.On;
settings.TraceEnabled = true;
settings.Update();
Developer Dashboard on custom master page in SharePoint
To use Developer Dashboard on custom master pages, keep the Developer Dashboard Launcher and page rendering control on the custom master page.
For the developer dashboard launcher:-
Where on the page it will reflect and render the output on.
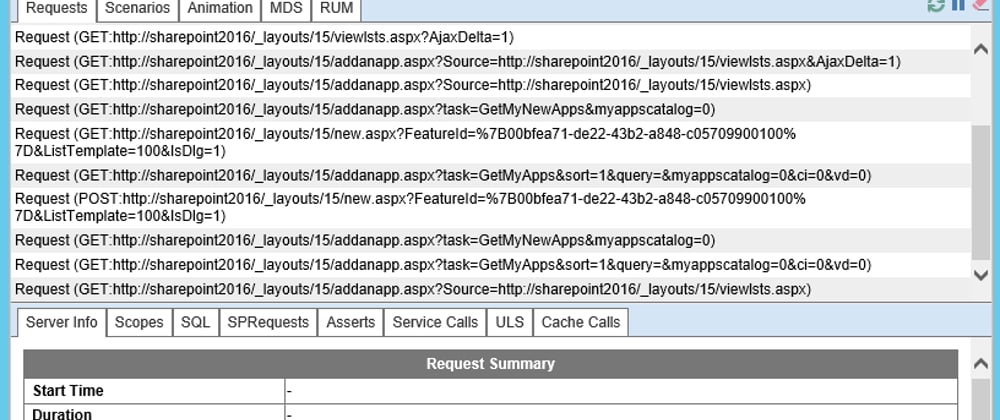
Viewing Logs with Developer Dashboard
Using below steps, we can view the ULS logs in developer dashboard.
- Log to your site
- From the right side of ribbon, click on developer dashboard. Developer dashboard will pop up in new window.
- Browse the link to troubleshoot. It will start logging the session requests.
- Select the request you want to investigate and click on related ULS log entries.
Recommendation
Most important, it gets enabled to whole farm and not particular to any site collection. So, its recommended ton use in test environments. Then turn it off in production environments.
Summary
Developer dashboard is very helpful to developers in writing performance tuned code and ability to debug errors.


Top comments (0)