
Recently I noticed a significant increase in Azure costs on a client project. For this particular client cloud storage is used for virtual machine disks, a few assets and hosting of a set of application. Cloud storage costs is something I've almost thought of as free. Naively.
Over a short period of time storage costs increased more than 300%. Weird. I checked and compared usage over a couple of billing periods. No spikes in user traffic that could explain this.
Fortunately Azure Cost Analysis lets you dive pretty deep on all individually incurred costs. The majority of costs was incurred by 'lrs write operations'. Digging into the 'Total Requests' metric of the storage account I was seeing approx. 1.4M requests per hour.
Drilling further into ingress/egress metrics revealed almost no data moving across the network 🤔
Next step was grouping the different kinds of requests making up those crazy numbers. Only a single operation stood out with millions of operations occurring during a regular day: ChangeNotify.
What changed?
So, troubleshooting 101...what has changed? Going through the latest commit log revealed upgrades to a few Azure Functions projects (sharing storage). The projects was updated to Azure Function v3 runtime and moving from .NET Core 2.1 to .NET Core 3.1. But no code changes.
This gave a few Google'able hints to go for and surely I was not the only one seeing this.
Apparently the culprit seemed to be how IConfiguration was built and used inside individual functions. In the oldest of the functions, before DI in Azure Functions was a thing, I had this approach to accessing the configuration data:
var config = new ConfigurationBuilder()
                .SetBasePath(context.FunctionAppDirectory)
                .AddJsonFile("local.settings.json",
                    optional: true,
                    reloadOnChange: true)
                .AddEnvironmentVariables()
                .Build();
In particular this line below was causing the issue:
.AddJsonFile("local.settings.json", optional: true, reloadOnChange: true)
'local.settings.json' is as the name implies meant for local usage/testing scenarios. It is never committed to source control and thus never published to Azure. But even though it is marked as optional, something in the Azure Functions runtime goes crazy because of this "missing" file.
I cleaned up the old functions and allowed for them to use constructor injection of whatever configuration was needed in the functions. This was I completely removed the above code block initialising the config.
Did a few quick tests and deployed to production. Either way the functions would be better off that before. But immediately I saw the transactions count dropping.
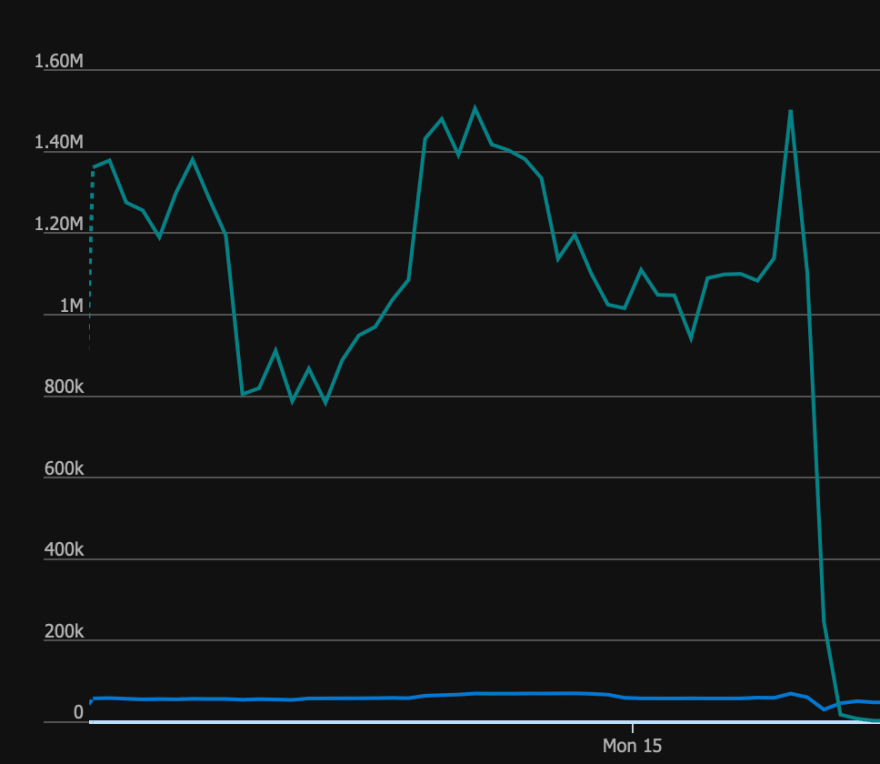
Guess when my cleanup was deployed? 😀
Lessons Learned
I have no idea why the increased storage operations was triggered after upgrading to a newer runtime. But my best bet is that the Azure Functions team have had a regression 🤷♂️
This issue was a welcome opportunity for me to learn more about the Cost Management part of an Azure Subscription. Going forward monitoring of cost analysis grouped by resources will be Yet Another™️ activity to include in my day-to-day operations.


Top comments (5)
I am also seeing this with a nodejs function app and have contacted azure support. There appears to be many tickets open in regard to this.
I am not accessing the configuration builder since it is nodejs and not .net, any thoughts?
Thank you for your comment. Sorry, I'm late to reply I somehow missed the notification.
Is this new behaviour for you? I was wondering if your issue is also related to a package upgrade?
Also, are you able to identify which operation(s) that are causing this. Like in my case where it was ChangeNotify.
Does anything seem out of proportion? Are you seeing a lot of failures?
If you have a lot of failures try switching to the "Failures" tab to identify which type of transactions are failing.
Let me know if I can help you track this down.
Thanks!
Here's the last 14 days from my storage account. The peaks for the file transactions appear to be related to function app deploys.
I'm using github actions to deploy the functions
I’m not sure what the cause is, but I am running other storage accounts with way more data transfer and data stored for fractions of the cost that the one associated to azure functions is incurring.
Thanks for posting this! I had the same issue and it started costing a lot. My chart was showing >6 million transactions in the last 4 hours!
As a quick solution, I surrounded my code in compiler flags (#if DEBUG), and upon release, the spike immediately dropped. I was also chatting with Azure support and sent them this article and let them know this fixed it.
Dear Peter, we are facing very similar issue.
As Azure-newbie, may I ask you how to create the requests you mentioned in "Next step was grouping the different kinds of requests making up those crazy numbers. "?
Thank you very much!