
I was challenged to find a way to step through some code. Usually I’d just fire up my IDE and start debugging, but this case was a bit more complicated than that. You see, this code is Lua code, running inside a custom version of NGINX called Openresty, running inside a Docker container as part of a Docker Compose app. Oh, and I needed to step through it using IntelliJ IDEA.
Can’t be too hard, right?
- How do other people do it?
- Last thing’s first
- The process
- Summing it all up
- Bonus: Hot reloading the Lua code
- Parting words
How do other people do it?
I sat down and read a lot of material online and most of it boiled down to one of two things:
- Use ZeroBrane Studio, an entirely different IDE with a debugger named mobdebug.
- Print debugging to the logs.
Neither one of those things were what I wanted to do, which got me thinking that, in order of likeliest to least:
- Someone got it working but never documented it,
- It’s a terrible idea that I shouldn’t even consider trying, or;
- It’s never been done.
After a few days of work, I found the way to do it and the following is an explanation of how you could do it yourself.
Last thing’s first
If you don’t really care about the journey and why these things actually work, you can jump over to Summing it all up and see the end result there.
The process
Starting out
I’m assuming that:
- You have IntelliJ IDEA.
- You have a working Docker Compose app with an Ubuntu-based Docker container named nginx running Openresty with your custom Lua code that you want to debug.
Fire up IntelliJ IDEA and install the EmmyLua plugin for IntellIJ. Note that this is not the Lua plugin, which I couldn’t get to work in the latest version of the IDE.
Bootstrapping the debugger
To start debugging, you’ll have to create a new Debug configuration. Go to Run → Edit Configurations... and add a new Emmy Debugger config.
Set Connection to Tcp ( IDE connect debugger ), and Keep Host and Port as localhost and 9966.
The dialog is kind enough to generate a snippet of code you can copy and paste to your Lua code to bootstrap the debugger in its context.
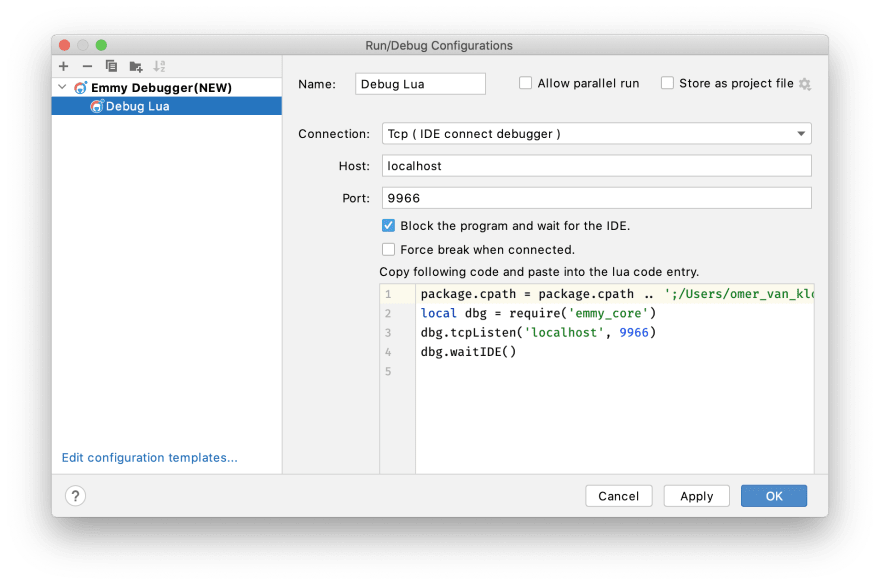
What IDE connect debugger means is that the code will start listening on port 9966 for incoming connections, then block until the IDE attaches to it when we run this Debug configuration.
Here’s the code I copied from that textbox verbatim:
We’ll have to add this code to the file we’re debugging so that it can wait for the IDE to attach, after which we’ll theoretically be able to step through it, right?
There are a few red flags here. Let’s break them down one by one:
- The first line references a local file that is also a Mac-only
dylib(Dynamic Library) and we’ll be running a Linux-based container (which means we need ansofile - a Shared Object). We won’t be able to load that file. - The debugger is listening on localhost, but we’ll be inside a container.
- If we have multiple code paths that run this code one after the other, we’ll have errors since the port is a shared resource.
While the port contention (#3) can be solved with either closing the port quickly (using dbg.stop()) or using a random port, the first two merit some more detail.
The Local Dynamic Library
We’ll need a local binary inside the container to load, and it has to be the right one.
While Emmy releases Linux SO files for Emmy Core as part of their builds, they’re not necessarily compatible with whatever flavor of Linux your container will have. We’ll have to build it from source as part of building the image:
The above gets the latest released version of the source code (1.0.16 is the latest at the time this is written) and builds it according to the script in the repo’s .travis.yml file (lines 7-8). It then copies the SO file to the easily reachable /usr/local/emmy (lines 9-10) before removing the downloads (line 13).
Like me, you might not be able to build it because you have an older version of CMake than is required. In that case, add the correct one before compiling the Emmy Debugger SO:
Here we download the latest version of CMake 3 which is required to build Emmy Core (line 1), then build it from source (lines 5-7), remove the downloads (line 9) and update Ubuntu to use it instead of the default CMake (line 10).
Back to the code we used to bootstrap the debugger:
Let’s change line 1 to match the new Container-local Emmy Core:
Listening on localhost
We told our code to bind to localhost on port 9966, but that doesn’t help us since we’re inside a Docker container. Let’s expose that port to the host computer so that it’s reachable.
In your docker-compose.yaml, add the following lines 3-4:
This exposes 9966 as a port local to the host machine. When the IDE opens a connection to it, that connection is proxied into the container.
Let’s step!
After doing all of that, let’s give it a try! Let’s place a breakpoint after the dbg.waitIDE() line, start our Docker Compose app, then call the endpoint that includes the code to debug and, as it waits for us to connect, run the Debug Configuration.
That doesn’t work, though. The code waits for the debugger, the debugger successfully connects and then disconnects. Our breakpoint isn’t even hit!
![[1] debugging fails](https://res.cloudinary.com/practicaldev/image/fetch/s--6KctFeiu--/c_limit%2Cf_auto%2Cfl_progressive%2Cq_66%2Cw_880/https://dev-to-uploads.s3.amazonaws.com/uploads/articles/ejhgcthf6s4syothuwjp.gif)
Matching sources
The issue here is that when we place a breakpoint in the IDE in the file /Users/omer_van_kloeten/my_project/src/lua/something.lua, the debugger will never stop there, because that path doesn’t exist in the container. Instead, this file will be somewhere like /etc/nginx/lua/something.lua. How can we make that translation?
I scoured the documentation, but found no API that could do that. Begrudgingly, I started trudging through the debugger’s source code and eventually found a public API hook, with only a single line example. Was this the right API? I read through the sources and tried it and it just worked!
Here it is - this code should be placed before loading the debugger:
The fixPath function gets a file’s path and ‘fixes’ it to look like the paths the IDE expects.
Looks like this will solve it. Let’s try again to place a breakpoint after the dbg.waitIDE() line, start our Docker Compose app, then call the endpoint that includes the code to debug and, as it waits for us to connect, run the Debug Configuration.
It works!
![[2] debugging works](https://res.cloudinary.com/practicaldev/image/fetch/s--J9sD_XPr--/c_limit%2Cf_auto%2Cfl_progressive%2Cq_66%2Cw_880/https://dev-to-uploads.s3.amazonaws.com/uploads/articles/vgb9qgiimyjw94ch8fgo.gif)
Works on my machine
This was exciting, but committing this kind of code would get me tarred and feathered. Let’s make sure this works on everyone’s machine. But how can we know, from inside a running container, where the host machine’s source code is located? Let’s use an environment variable.
Let’s make a couple changes to the code above:
First off, we added line 1, which fetches the environment variable. We’ve also changed line 4 to use the value from that environment variable.
This means we’ll need to get the value /Users/omer_van_kloeten/my_project/src into the variable.
It’s not that trivial to get that environment variable into the code, because Nginx strips away almost all environment variables. We’ll have to whitelist it in nginx.conf:
Now we’ll want to send it into the container at runtime. Inside docker-compose.yaml, let’s make sure our local environment variable is pushed to the container as a local environment variable:
We’ve added the environment variable in line 4, but didn’t give it a value. That means it will pick up the value from the host environment when it’s started.
Before we docker compose up our app, we’ll need to first export the environment variable:
Stepping through the code will now work on all of our colleagues’ computers!
Summing it all up
A word of warning
This guide covers only the first steps towards making robust debuggable code. You do not want to ship your code with debugger binaries listening on a port for connections.
This guide is far from comprehensive and doesn’t allude to being one-size-fits-all. I’d love to hear how you fixed issues with it in the comments. Come share your personal progress!
What changed?
Here’s all of the changes we made to our code in easily copy-paste-able gist form:
Next steps
This way of debugging means that the code waits for the debugger to connect to it, when it uses tcpListen. However, this is not that great because it waits for user interaction (starting the Debug Configuration). If we used tcpConnect, we would be able to start the debugger and have the process connect directly to it when it needs to, without user interaction. Unfortunately, I was unable to make that work within a reasonable timeframe when listening on 0.0.0.0 and attempting to connect to host.docker.internal from inside the Docker container. Perhaps you will.
Bonus: Hot reloading the Lua code
A lot of the above included frequently changing Lua code and rebuilding the container, causing the feedback loop to be frustratingly long. If we can edit the files inside the container, that would make things much easier, right?
To do that, let’s attach our sources as a volume to the container in docker-compose.yaml:
In line 3 we’re effectively replacing the files that exist inside the container with a live link to our local ones.
However, Openresty has a Lua code cache which will cache the code once it’s been run. Thankfully, we can turn that off in our nginx.conf:
Unfortunately, this neat trick breaks the reproducibility of Docker images, so these patches to docker-compose.yaml and nginx.conf should never reach your CI server.
Note that you may also break your code if you turn off the Lua cache, due to its side effects.
Parting words
Please remember that this guide only outlines bootstrapping the ability to step inside the code, and therefore should probably not be used as-is. It was a fun challenge to take up and I sincerely hope that this guide is some day useful to someone other than myself.
Omer van Kloeten is a Principal Software Engineer at Forter.


Top comments (3)
This is great write up. I’m trying to do the same thing.
Never Mind: Managed to find answers and made it work. Also provided the answer above.
@omervk
this was real helpful thanks !
I just pushed a small bare repo that gives a working debug layout, some stuff changed at the margin from your blog post, but overall it was so helpful with it.
github.com/euri10/debuglua/
Incredible work you've done here. I'm halfway through and it will probably take me the rest of the day to consume what you created. But you must admit that Lua/Openresty debugging state of the art is abysmal. This is so complicated I wish I could step through the debugger/IDE connectivity bootstrapping code... oh wait.