Note: This is re-share of one of my most popular posts that was originally published back at the end of 2018 to my old website. Sharing again now to keep up my streak of posting each day so I can ship some work features (on a Friday, I know 🤦). If you would like to see some more neat diagram content in the future (using libraries such as D3), follow to have them straight into your feed!
See the original blog post here.
This is a small intro into building HTML diagrams on the fly.
I really, really want to be able to visualise some stacks I am building on the go down the track, so I thought this would be a very convenient way to explore that.
Getting started
tl;dr
create-react-app hello-mermaid
cd hello-mermaid
yarn add mermaid debounce
Basics
For this particular example, I decided just to use create-react-app hello-mermaid just to get things up and going.
Once this installs, changed into the folder and either yarn add mermaid or npm install mermaid --save.
In this scenario, I want to also dynamically update the chart, so also add in yarn add debounce or npm install debounce as I will use a textarea html element for this which I want to only fire once after being debounced. Check my original blog post on debouncing in React for more information.
The code
I decided to start using the intro learn page for mermaid to get up and going. Following the instructions, I updated my src/App.js file to look like the following:

What’s going on here? First of all, I am importing the required packages.

Secondly, I have updated the render code to give me a div to target with the outputted graph and a text area I can add markdown into:

Third, I want to initialise the graph with a basic chart on mount:

Finally, I add the handleChange function to attempt an update to the graph.

Now, when we run yarn start on the terminal and the web page opens up, we get the following site:
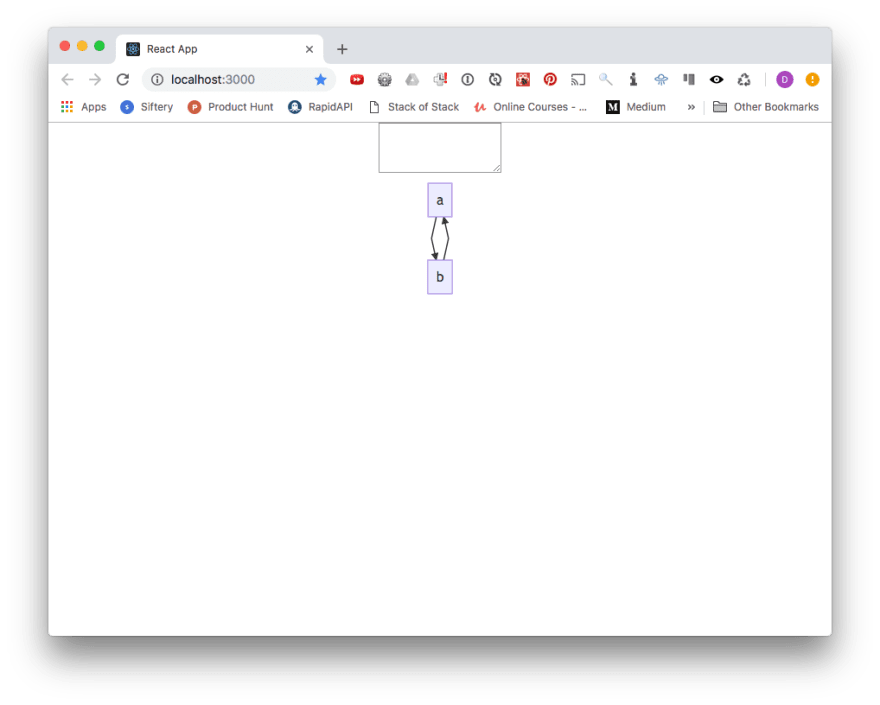
Great! Now thanks to our handleChange function and graceful handling, we can also dynamically update the chart on the fly.
I’ve added a few examples from the web that you can now copy and paste into our text box to see how it works!
graph LR
  A[Hard edge] -->|Link text| B(Round edge)
  B --> C{Decision}
  C -->|One| D[Result one]
  C -->|Two| E[Result two]

sequenceDiagram
  Alice->>+John: Hello John, how are you?
  Alice->>+John: John, can you hear me?
  John-->>-Alice: Hi Alice, I can hear you!
  John-->>-Alice: I feel great!

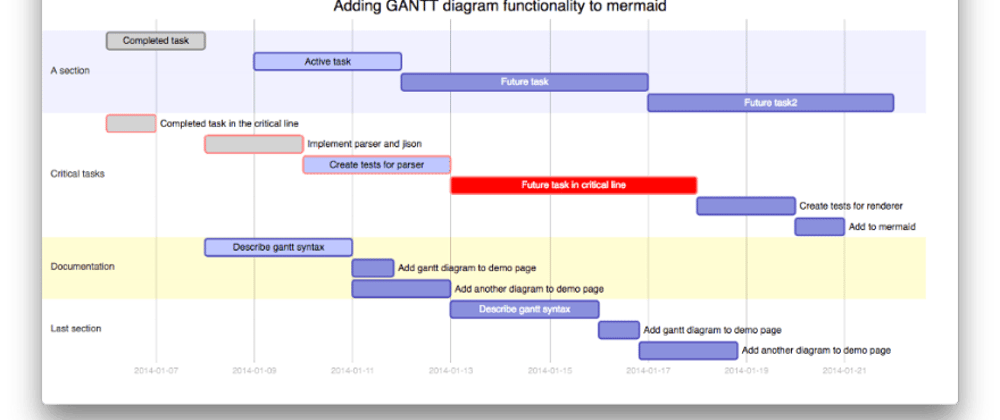
We can even do something as complex as a Gannt chart! Updating the textarea with more complicated examples can give us the following:
gantt


       dateFormat                :YYYY-MM-DD
       title                     :Adding GANTT diagram functionality to mermaid
       excludes                  :excludes the named dates/days from being included in a charted task..
       (Accepts specific dates in YYYY-MM-DD format, days of the week ("sunday") or "weekends", but not the word "weekdays".)
       section A section
       Completed task            :done,    des1, 2014-01-06,2014-01-08
       Active task               :active,  des2, 2014-01-09, 3d
       Future task               :         des3, after des2, 5d
       Future task2              :         des4, after des3, 5d

       section Critical tasks
       Completed task in the critical line :crit, done, 2014-01-06,24h
       Implement parser and jison          :crit, done, after des1, 2d
       Create tests for parser             :crit, active, 3d
       Future task in critical line        :crit, 5d
       Create tests for renderer           :2d
       Add to mermaid                      :1d

       section Documentation
       Describe gantt syntax               :active, a1, after des1, 3d
       Add gantt diagram to demo page      :after a1  , 20h
       Add another diagram to demo page    :doc1, after a1  , 48h

       section Last section
       Describe gantt syntax               :after doc1, 3d
       Add gantt diagram to demo page      :20h
       Add another diagram to demo page    :48h

Next steps
Very cool! Now we can easily start creating some cool dynamic flows. What next? Be creative! I am planning to parse the markdown or html from the outputs and use it to help generate important reports or pseudocode to help build out some infrastructure or database schemas.
You can see the final code on the repo here.


Top comments (0)