
This post originates from https://rachelisaweso.me/posts/serverless-lambda-pt2/ and is by Rachel White @ohhoe
Datadog makes setting up monitoring on your serverless function easy with our AWS Integration.
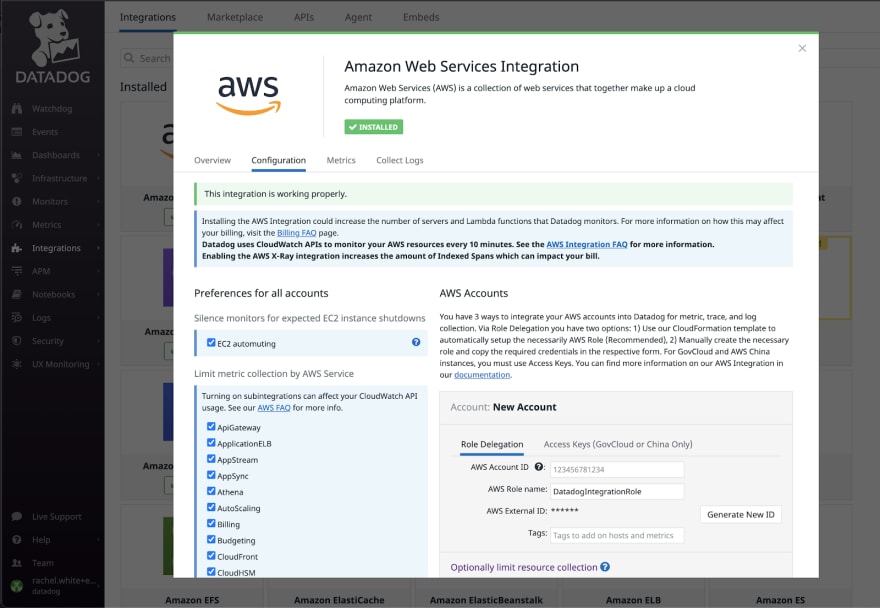
The first part is enabling the AWS integration. Head to the AWS integration tile and fill in your information.
The AWS integration sets up some IAM roles and begins scraping your AWS account for information about what’s going on within your AWS infrastructure.
Next we set up the Datadog Forwarder Lambda function, which is required for ingestion of AWS Lambda traces, enhanced metrics, custom metrics, and logs.
https://docs.datadoghq.com/serverless/forwarder/

You can just launch right from our documentation. It’ll ask you for your Datadog API key, which you can find under Integrations > APIs on your Datadog Dashboard.
https://app.datadoghq.com/account/settings#api
Now that we’ve added the integration and forwarder, we can begin to instrument our Lambda function.
We’ll need to is add some more information to our serverless.yml file.
custom:
  datadog:
    flushMetricsToLogs: true
    apiKey:
    addLayers: true
    logLevel: "info"
    enableXrayTracing: true
    enableDDTracing: true
    forwarder:
    enableTags: true
    injectLogContext: true

plugins:
  - serverless-plugin-datadog
https://docs.datadoghq.com/serverless/serverless_integrations/plugin/
Our serverless plugin has configuration options that you can use as needed for your specific use cases. You’ll need to add your Datadog API key here.
In addition to the serverless plugin, we’re going to add the AWS X-Ray integration, which lets developers trace distributed applications built using AWS products.
https://docs.datadoghq.com/integrations/amazon_xray/?tab=nodejs
You need to make sure the following permissions are present in the policy document for your AWS/Datadog Role before adding to your code.
'use strict';
const AWSXRay = require('aws-xray-sdk');
const AWS = AWSXRay.captureAWS(require('aws-sdk'));

AWSXRay.captureHTTPsGlobal(require('http'));
AWSXRay.captureHTTPsGlobal(require('https'));

// captures axios chained promises.
AWSXRay.capturePromise();

const AxiosWithXray = require('axios');
After that we head back to our handler.js file from Part 1. Run npm install aws-xray-sdk and require it in your Lambda function first because you want to catch everything that happens after it’s included.
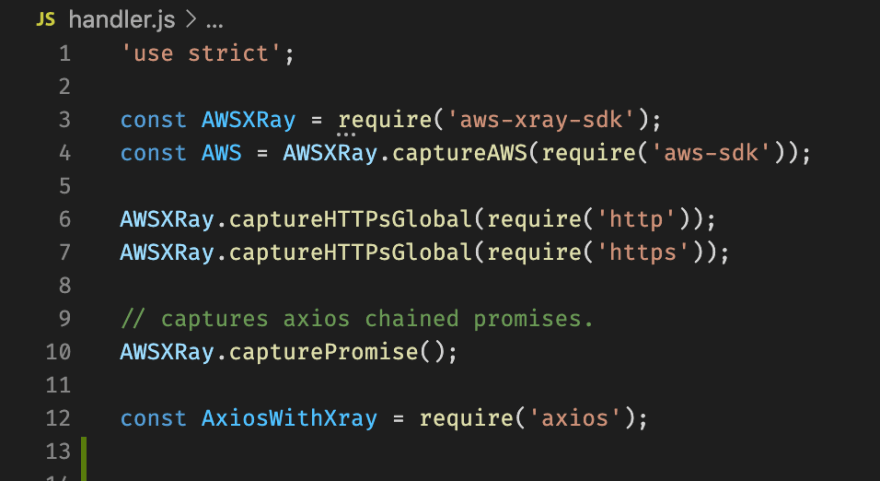
We add the code for capturing all HTTP and HTTPS traces, as well as capturing chained promises, which is super important since so much of Node.js is promise based.
We’re also going to change the Axios global name to axioswithxray just so we remember we’re catching those responses as well. We’llchange the line in our code that was previously making the Axios call as well.
Run sls deploy one last time so our instrumentation is fully reflected in our serverless function, and that’s all we have to do for our specific use case.
You can see additional documentation for tracing SQL queries and other options on the X-Ray documentation: https://docs.aws.amazon.com/xray/latest/devguide/xray-sdk-nodejs.html
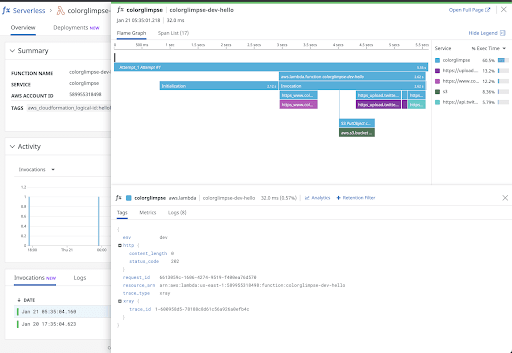
Now that we have set up the AWS Integration and instrumented our serverless application, we can begin to have more insight into how our systems are working.


Top comments (0)