Debugging has always been part of my experience with computers, even before learning how to code. However, the satisfaction of unfolding a binary and modifying a program behaviour has never been hassle free.
Normally, debugging consists on switching back and forth from hex editor to debugger, application, terminal, calculator… not to mention the program exiting and that very long recipe you had to follow until reaching the point where your debugging session finished abruptly. Not good…
But few months ago, with the excuse of cracking Twitter for macOS, I decided to minimise this problem and optimise this flow. That is when Xcode came to the rescue.
Setup
First of all, we need to create a Xcode project with a Cocoa Framework as target.

Debugging
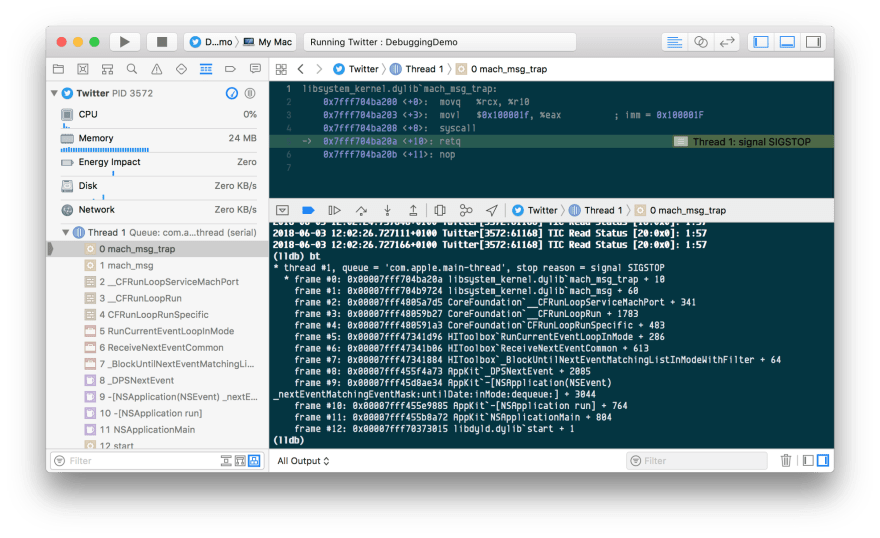
We will use the embedded lldb console for dynamic debugging.
Imagine that Twitter for macOS is the app we want to debug. Normally, we would need to run lldb and launch the process from the debugger, instead, Xcode can do this for you every time we click on the Run button.
To do so, select the Twitter application as executable in the Run configuration of our framework’s scheme.

This way, our framework will be compiled and the Twitter app launched with lldb attached to the process.
Injecting code
What we have done so far could be a sufficient achievement, we can easily create a debugging session targeting an application and also take advantage of the commands autocomplete Xcode provides. But what about injecting code?
Code injection usually involves compiling a dynamic library and patching the binary so it links to our library. Still, debugging the code we inject is a tedious task and the process slow and repetitive although we can always automate parts of it.
Now, thanks to Xcode flexibility configuring schemes and a bit of magic we can patch the runtime of the application we are inspecting easily and without modifying its binary (double win).
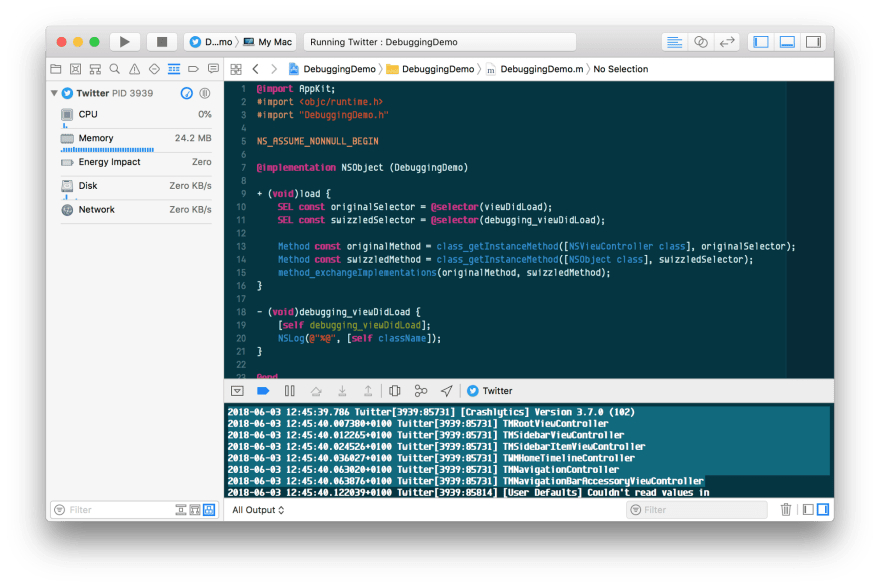
As an example, let’s inject some code that logs every call to viewDidLoad.
The Cocoa Framework project template creates a header file called nameOfTheProject.h. We are going to create its respective .m file and place in it the swizzling logic.

As it is, Xcode will compile our framework and launch the Twitter application with the debugger attached to its process. Linking these two is as easy as running the process with an environment variable that forces the load of a library located at the path given. This environment variable is DYLD_INSERT_LIBRARIES and the path of our library ${TARGET_BUILD_DIR}/${TARGET_NAME}.framework/Versions/A/${TARGET_NAME}.

After setting the environment variable in the Arguments tab of the Run configuration of our scheme click the Run button. Our code should have been correctly injected into the Twitter process.
Not good enough? all the other debugging goodies Xcode provides are also available, from the view hierarchy to the memory graph debuggers.

Summing up
Whether your are into reverse engineering or not, I encourage you to give this a try and also play with TwitterX for more about the capabilities of this setup.


Oldest comments (2)
I love the idea of this.
However, I am struggling to get this working for Zoom.app.
Message from debugger: Error 1
My understanding is this is because of hardening being built into the app.
Any thought to how to get this to work?
Some comments may only be visible to logged-in visitors. Sign in to view all comments.