Grafana has become the world’s most popular technology used to compose observability dashboards with everything from Prometheus & Graphite metrics, to logs and application data to power plants and beehives.
• Customers use its open-source analytics and interactive visualization web application.
• It provides charts, graphs, and alerts for the web when connected to supported data sources.
Today, let’s look at building a Grafana dashboard for an Amazon Linux EC2 Instance using Prometheus as Data Source.

Prometheus uses Node_exporter to scrap data from EC2 instance and display them in Grafana dashboards.
• Let’s launch an EC2 Linux Instance from the AWS Console. Make sure, that the security group is allowing all the traffic into the instance (Generally, opening the instance to all the traffic is not advisable for Production based systems).
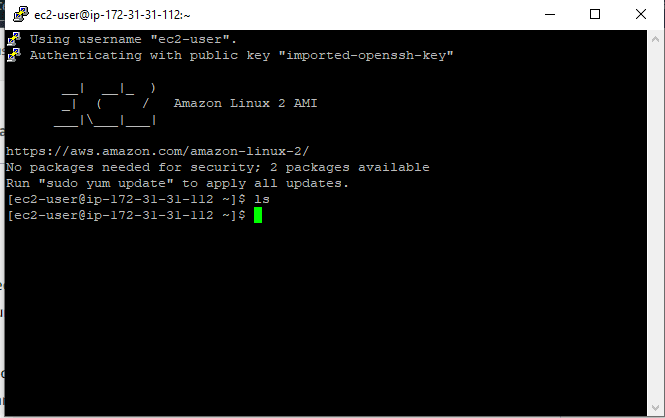
• SSH into the EC2 instance.
• Now, let's install node_exporter onto the EC2 Instance.
• Run the following command to change the directory to /opt/
cd /opt/
• Now, run the following command to download the node_exporter binary file:
sudo wget https://github.com/prometheus/node_ex porter/releases/download/v1.1.2/node_exporter-1.1.2.linux-amd64.tar.gz
• Run the following command to extract the downloaded file:
sudo tar xf node_exporter-1.1.2.linux-amd64.tar.gz
• Rename the file name “node_exporter-1.1.2.linux-amd64” to “node-exporter” for easy execution.
Run the following command change the name:
sudo mv node_exporter-1.1.2.linux-amd64 node_ex porter
• Let’s start the node-exporter agent on the server by running the following command:
cd node_exporter
sudo ./node_exporter
• Go back to the EC2 Management Console and copy the Public IP address of the EC2 Instance.
• Run the IP Address on your browser with the extension :9100

If you click on "Metrics" button. You would see all the metrics displayed on the screen.

Now, we need to launch two instances from the console. One for Prometheus and the other for Grafana.

• SSH into the Prometheus Instance.
• We need to install the Prometheus agent into the EC2 Instance. Run the following command to install Prometheus.
cd /opt/
sudo wget https://github.com/prometheus/prometheus/releases/download/v2.26.0/prometheus-2.26.0.linux-amd64.tar.gz
• Let’s extract the downloaded file by running the following command:
sudo tar xf prometheus-2.26.0.linux-amd64.tar.gz
• We will be renaming the file “prometheus-2.26.0.linux-amd64” to “prometheus” for easy access.
sudo mv prometheus-2.26.0.linux-amd64 prometheus
• Change the directory to prometheus:
cd prometheus/
• Running the below command will open the Prometheus.yml file in a text editor.
sudo vi prometheus.yml

• In the text editor, enter the value of the EC2 instance’s IP address at “target” under “static_configure” with extension :9100 and save the file.

• Enter the Public IP address of the Prometheus server with the extension :9090 in your browser.
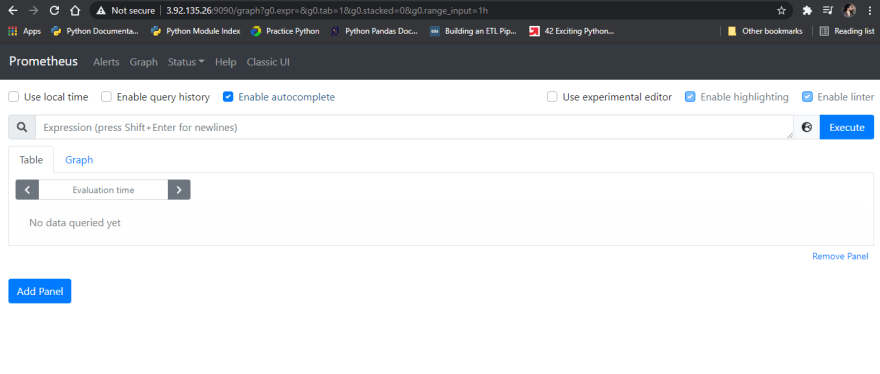
• You should be able to see the Prometheus Dashboard page.

• Select “Targets” in dashboard.

Its time to configure our final instance for Grafana.
• SSH into the Grafana instance which we already created.
• Run the below command in the SSH prompt to install Grafana binaries into the server. It will open a text editor
sudo vi /etc/yum.repos.d/grafana.repo
• Paste the below text in the editor to provide the configuration for the Grafana server. Save and close the text editor
[grafana]
name=grafana
baseurl=https://packages.grafana.com/oss/rpm
repo_gpgcheck=1
enabled=1
gpgcheck=1
gpgkey=https://packages.grafana.com/gpg.key
sslverify=1
sslcacert=/etc/pki/tls/certs/ca-bundle.crt
• Time to install, start and enable Grafana. Run the below commands one after the other:

sudo yum install Grafana
sudo systemctl start grafana-server
sudo systemctl enable grafana-server
• Now, type the Public IP address of the Grafana instance in the browser with the extension :3000
• Enter ‘admin’ as username and password.

• You will be prompted to change the password. Enter the new password and confirm it.
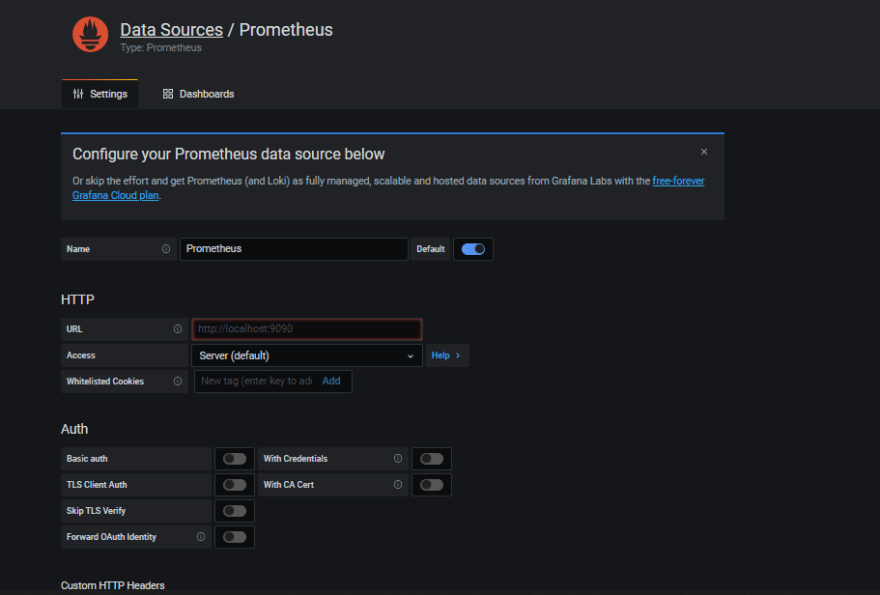
• Now, select Prometheus Private IP address as data source.

• Since both Grafana and Prometheus are available in the same network. We use private IP address for Prometheus.
• Select the Dashboard Template “Node_exporter”

Finally, the Grafana Dashboard for EC2 linux instance using Prometheus is ready!


Top comments (1)
thanks <3