What are outliers?
Outliers are data points that are far from most of the other data points.
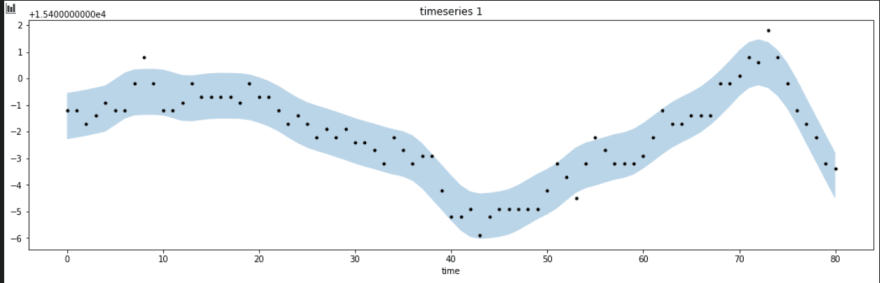
In this example of time series, all the points outside the blue band can be considered as outliers.
How to get a list of outliers in a time series?
Here we will use a library called tsmoothie.
It is a python library for time-series smoothing and outlier detection in a vectorized way.
On the time series in the figure: we can see that we have 4 outliers, we can get them by:
import numpy as np
from tsmoothie.utils_func import sim_randomwalk
from tsmoothie.smoother import LowessSmoother
data = df['value'].values.reshape(1, -1)
# operate smoothing
smoother = LowessSmoother(smooth_fraction=0.1, iterations=1)
smoother.smooth(data)
# generate intervals
low, up = smoother.get_intervals('prediction_interval')
points = smoother.data[0]
up_points = up[0]
low_points = low[0]
for i in range(len(points)-1, 0, -1):
current_point = points[i]
current_up = up_points[i]
current_low = low_points[i]
if current_point > current_up or current_point < current_low:
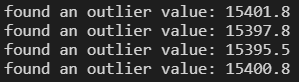
print(f'found an outlier value: {current_point}')
Considering that the data frame df has a column named 'value'.
So, we get this output after running the code:


Top comments (1)
Could you include the df that make the upper graphic, please? To be sure I understand your code it would be good to reproduce the output exactly, then try it on my data.