
It comes as no surprise that for any ecommerce business like SSENSE, there are peaks and valleys in terms of customer traffic. There are periods of relative calm, followed by high-traffic periods where we experience up to 80 times the regular traffic. This can come during drops of highly anticipated items — like sneakers — the start of our seasonal markdown periods, and around the holidays.
It should come as even less of a surprise that when dealing with a microservice architecture, you have to pay extra attention to the resiliency of your stack to avoid any downtime. The last thing that any developer wants, is a domino effect of downward dependencies causing downtime of a service that’s 5 levels up.
At SSENSE, we set an extremely aggressive target for ourselves of having a 99.95% yield during these critical moments for the business. Among many steps that we took, handling graceful degradation was key in ensuring we did not experience any downtime during a critical period for the business.
The degraded experiences were broken down into two main strategies:
- Automatic degradation
- Planned degradation
Automatic Degradation
To automatically degrade our services we leverage circuit breakers. The basic idea behind the circuit breaker is very simple. You wrap a protected function call in a circuit breaker object, which monitors for failures. Once the failures reach a certain threshold, the circuit breaker trips, and all further calls to the circuit breaker return with an error/empty or result/cached result, without the protected call being made at all.

The library we leveraged is called opossum.js, an open source Hystrix compliant library. It's relatively easy to use, and is very configurable. The key attributes that we configured were:
- The api timeout: If our function takes longer than this value seconds, trigger a failure.
- The error threshold percentage: When this error percentage of requests fail, trigger the circuit.
- The reset timeout: How long to wait before trying again.
- The rolling count timeout: Sets the duration of the statistical rolling window, in milliseconds. This is how long opossum keeps metrics for the circuit breaker to use and for publishing.
- The volume threshold: The minimum number of requests within the rolling statistical window that must exist before the circuit breaker can open.
Although opossum is extremely easy to use, in order to ensure it's adoption internally, we decided to simplify it even more and turn it into a decorator.
This allowed us to wrap our gateway calls in a circuit breaker like so:
To translate this decorator into plain English what it means is that:
If after 3 errors within 10 seconds, we still get response times of 5+ seconds or 55%+ requests fail then open the circuit and call the fallback method. Try one call to the original product-service again after 15 seconds, if it works then close the circuit and go back to normal, if it fails keep the circuit open.
We sprinkled these decorators across our code, and got seamless fallbacks if errors started happening within our stack.
Planned Degradation
The second step we took is to define our planned degradation and what that means for the customer experience. While the automated degradation was mostly decided within the tech team, the planned degradation was a collaboration between tech and product.
Our goal when working on this was: "How can we protect our stack in advance from surges in traffic, by turning off some features while still maintaining an acceptable user experience?"
This was cross functional work with multiple teams, stakeholders, tech leads, and project managers. To be able to roll this out we leveraged a tool that we use extensively at SSENSE: LaunchDarkly. We use LaunchDarkly internally to manage our feature flags to be able to enable/disable features in an instant, either for the whole user base or on a percentage based rollout.
The next part was how to operationalize this in an efficient manner. The questions we had to ask were:
- When do we enable these features?
- When do we disable these features?
- What is the customer impact?
- What is the business impact?
- What services does this affect?
To answer the first two questions, we broke down our degraded features into three sections:
- Go Live: Turned on ~1 hour before a high-traffic event, turned off when traffic dies down.
- Amber: Prolonged drop in yield for key funnel services or stack experiencing important latency, but still responsive. Decided in a war room session when to trigger this.
- Code Red: If critical flows are down, these feature flags will be activated. Decided in a war room session when to trigger this.
The next three questions were answered by:
- Digging into the code to look for dependencies.
- Inspecting our traces and flame graphs using Datadog.
- Regression testing with our QA team.
- Getting buy-in from stakeholders.
After all was said and done, here are a few examples of the planned degraded experiences we decided to go with:
- Disable one of our widgets on the product display page (2% decrease in downstream traffic)
- Disable our personalization models for the mobile app (decrease latency by 4x-5x)
Disable the counter on the Shopping Bag menu item (74% decrease in downstream traffic)
Display a static message for shipping rates in some use cases (decrease downstream calls by 500K/hour)
Use internal cache of Wishlist items (will continue working even if downstream source of truth is non responsive)
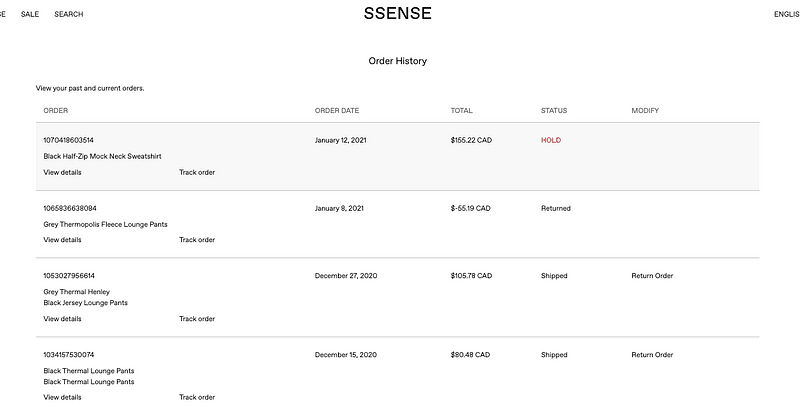
Disable the Order History page

- Simplify the order confirmation page


Results
Although these experiences showed a lot of promise during our load tests - with significant increases in throughput - it was time to put them to the test during our high traffic period.
Was all this work worth it?
Well, see for yourself.
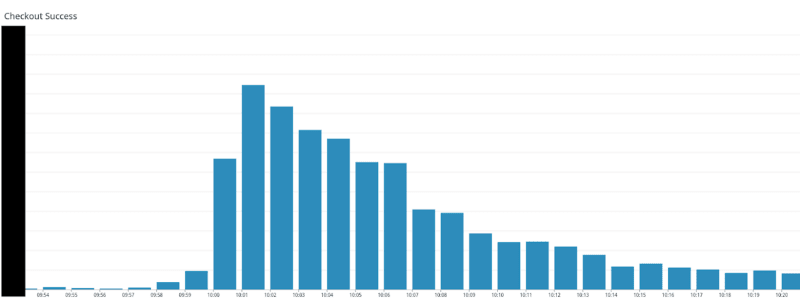
While I can't disclose the absolute number of checkouts, this relative graph will show just how much the checkouts grow during a high-traffic period - not including all the other types of traffic we receive. The stack performed flawlessly with no downtime and our YIELD goal of 99.95% was achieved.
The degraded experiences that were baked in are definitely not the only reason we did not experience any downtime. Teams worked and continue to work tirelessly to ensure stability across the stack with a slew of different initiatives to stabilize and improve the resiliency of our stack.
In the end, planning for degradation and handling it properly should be just one strategy in your arsenal when building a resilient product.


Top comments (0)