What is Normalization?
Let’s first understand here actually what is meant by data normalization and then we will come to the topic of Z score Normalization. So normalization is just a feature scaling technique which is needed for our features while feeding to the model of machine learning.
As our data is collected from a variety of sources, it might come from different places as it includes different scales for features too. So it becomes necessary to bring all those features to one common scale to feed the data further to the model otherwise it will lead to poor model building and it will have no impact or use in a real-world scenario.

Data normalization consists of remodeling numeric columns to a standard scale. Data normalization is generally considered the development of clean data. Data Normalization is preprocessing technique in machine learning and Z score is one of its types of it, also it includes other concepts or types such as minimax scaler, standard scaler, etc. but here we will going to look at Z-Score Normalization.
In the short feature, scaling is a technique to standardize the independent features present in data in a fixed range.
What is z-score normalization?
The letter ‘Z’ in z-score stands for Zeta (6th letter of the Greek alphabet) which comes from the Zeta Model that was originally developed by Edward Altman to estimate the chances of a public company going bankrupt. Also referred to as zero-mean Normalization. Z-Score helps in the normalization of data.
If we normalize the data into a simpler form with the help of z-score normalization, then it’s very easy to understand by our brains. It is a strategy of normalizing data that avoids this outlier issue. In this technique, values are normalized based on the mean and standard deviation of the data.
The essence of this technique is the data transformation by the conversion of the values to a common scale where an average number/mean equals zero and a standard deviation is one. Technically, it measures the standard deviations below or above the mean. Standardization or z-score normalization does not get affected by outliers because there is no predefined range of transformed features.
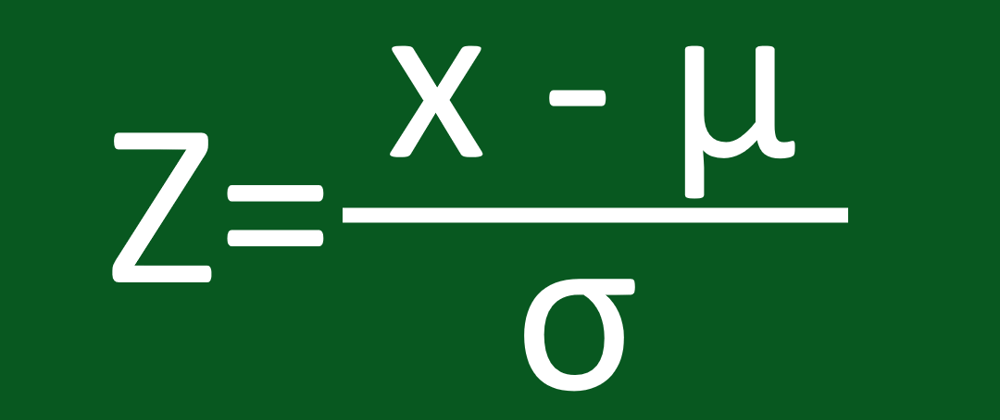
A value is normalized under the formula We use the following formula to perform a z-score normalization on every value in a dataset.

where ,
x: Original value.
μ: Mean of data.
σ: Standard deviation of data.
A z score represents the number of standard deviations a value (x) is above or below the mean of a set of numbers when the data are normally distributed. Using z scores allows the translation of a value’s raw distance from the mean into units of standard deviations.
If a z score is negative, the raw value (x) is below the mean.
If the z score is positive, the raw value (x) is above the mean.

For example, for a data set that is normally distributed with a mean of 60 and a standard deviation of 10, suppose a statistician wants to determine the z score for a value of 80. This value (x = 80) is 20 units above the mean, so the z value is,
Thus, z = (X – μ) / σ
= (80-60)/10
=2.00
This z score signifies that the raw score of 70 is two standard deviations above the mean. How is this z score interpreted? The empirical rule states that 95% of all values are within two standard deviations of the mean if the data are approximately normally distributed.
What is meant by Empirical Rule here...??
The empirical rule is an important rule of thumb that is used to state the approximate percentage of values that lie within a given number of standard deviations from the mean of a set of data if the data are normally distributed.

A normal distribution is shown below and it is estimated that ,
68% of the data points lie between +/- 1 standard deviation.
95% of the data points lie between +/- 2 standard deviation.
99.7% of the data points lie between +/- 3 standard deviation.

So, the z score is the number of standard deviations that a value, x, is above or below the mean. If the value of x is less than the mean, the z score is negative; if the value of x is more than the mean, the z score is positive; and if the value of x equals the mean, the associated z score is zero.
This formula allows the conversion of the distance of any x value from its mean into standard deviation units. A standard z-score table can be used to find probabilities for any normal curve problem that has been converted to z-scores.
Another Example
Suppose the scores for a certain exam are normally distributed with a mean of 80 and a standard deviation of 4. Find the z-score for an exam score of 87.
We can use the following steps to calculate the z-score:
The mean is μ = 80
The standard deviation is σ = 4
The individual value we’re interested in is X = 87
Thus, z = (X – μ) / σ = (87 – 80) /4 = 1.75
Here are some important facts about z-scores.
A positive z-score says the data point is above average.
A negative z-score says the data point is below average.
A z-score close to 0 says the data point is close to average.
A data point can be considered unusual if its z-score is above 3 or below -3
Advantages of z-score normalization.
It allows a data administrator to understand the probability of a score occurring within the normal distribution of the data.
The z-score enables a data administrator to compare two different scores that are from different normal distributions of the data.
We have already covered z score normalization in detail on our website. For more additional information visit the following link.
[https://ml-concepts.com/2021/10/08/z-score-normalization/]
Summary
In this article, I tried to explain Z score Normalization in simple terms. If you have any questions related to the post, put them in the comment section and I will do my best to answer them.
References
The following tutorials provide additional information on different normalization techniques.
https://en.wikipedia.org/wiki/Standard_score.


Top comments (0)