Debugging application distributed across services may be hard. With multiple applications communicating through different sources, we're not easily able to track all logs for given source. I've faced this issue especially when exchanging messages through GCP PubSub. Solution for that is tracing messages. Whole mechanism could be very flexible, and allow to track multiple metrics connected to some execution flow. In this post I will focus only on tracing messages, which helps to gather all from all services in one place. Before solution, I would like introduce some background.
Tracing
Tracing is a process in which we are following some execution flow across whole application. In case where we have only one server, it is easy task. When the message comes (eg. as a HTTP Request) we can track all logs in scope of it by quickly seeking through all entries logged after initial one, or by filtering thread which was handling it. When we have multiple services this scenario could not be achieved. This is why to all log entries there are added special parameters, which helps to determine across all services if particular log entry belongs to group started by our trigger (again, it could be HTTP Request, JMS message or CRON). We can distinguish two main parameters:
- Trace/Correlation ID - Depending on source the name differs. Microsoft prefers name Correlation ID, W3 calls it Trace ID. In the end it refers to same thing. It is added to each metric across some action. If we will send GET request to retrieve list of all our customers, and this call will trigger more services to fetch data from, each entry in each service in scope of this request will contain same trace id.
- Span ID - All log entries within particular service in scope of our execution flow, besides Trace/Correlation ID will contain also parameter called Span ID. It helps us to find all messages in scope of this Span in one service. Frequently we can see usage of it, to measure how long processing of task took in particular service.
Log4J
Log4J is widely used library for creating and storing logs, with great amount of configuration. It enables us to define how log entry should look like, which information it should contian, where to pass logs so they could be stored and many more. We will use it to create logs, and add to them necessary parameters, which later on will be used in GCP Logging console to group multiple log entries basing on TraceId which they share.
MDC
Mapped Diagnostic Context is special object in Log4J library which manages log entries coming from different contexts. It holds parameters for current context, which are added to log entry. MDC helds parameter about in scope of which TraceId and SpanId we're currently logging. It is assigned to thread, so if we will switch one, we have to remember to set parameters for new one as well.
How to make it real
Before starting, please create PubSub topic and subscription to it in your GCP console. Make sure that account which you will be using when playing around will have following roles assigned:
- Logs Writer
- Pub/Sub Publisher
- Pub/Sub Subscriber
Under this link you can find repo where code is stored - both publisher and reciever application. They are not so complicated - in Readme there is instruction which parameters of your own you have to set to make it work with your account. Server application accepts an HTTP request, and passes it through PubSub to receiver one. Receiver simply receives message and logs it. We would like to see logs both from server and client under the same group in GCP. Of course methods which are outside of Trace scope should not have this group assigned. In the server application the most important part is:
var pubsubMessage = PubsubMessage.newBuilder()
                .setData(data)
                .putAttributes(MDC_FIELD_TRACE_ID, MDC.get(MDC_FIELD_TRACE_ID))
                .build();
As one of attributes of our message, we're going to put MDC_FIELD_TRACE_ID parameter (which resolves to traceId). This is constant from StackdriverTraceConstants class. It is used to group logs, and thanks to it GCP Logging will be able to diffrentiate between different ones.
On the receiver side, after receiving message we need to do this:
MDC.put(MDC_FIELD_TRACE_ID, traceId);
MDC.put(MDC_FIELD_SPAN_ID, UUID.randomUUID().toString());
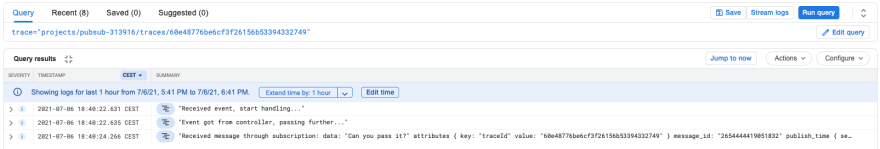
All logs inside thread where the message is handled, will have assigned traceId coming from message. This allows us to group messages through traceId across services which are exchanging messages through PubSub. This is unfortunately not available out-of-the-box. In logging console you can see messages only containing specific traceId which is shown in below screenshot
Unfortunately, this is not working with Tracing tool in GCP. Currently it supports only requests coming through the HTTP. Maybe some day they will introduce such feature, so we could stick only to Google tools, without requirement for installing other ones (like for example DataDog).


Oldest comments (0)