
Join me on this week’s post as I take SolidJS’ dev-tools for a spin and find out that even though it is not 100% “production ready” it already has some major value for anyone using SolidJS.
I recently bumped into SolidJS dev-tools and since I find SolidJS to be a very interesting and promising frontend framework I thought it would be a good idea to take it for a spin and see what values it offers.
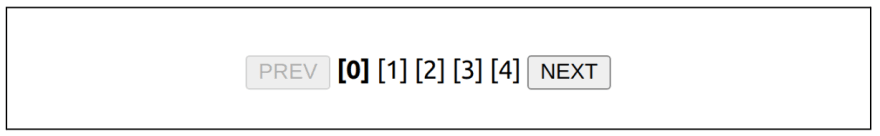
I’m gonna have my experiment on a simple SolidJS application (generated from one of the create solid app templates) and you can find the code in this repo: solid-js-lab. This repo has a single component, the “infamous” Pagination, which I migrated from React back at the time (you can read all about it here). Now let’s see if we can enjoy some debugging as well…
Disclaimer: Before we start it is important to note that solidjs dev-tools is still not available on the extensions store, and for a good reason too, as you’re about to witness for yourself. The project is not really “production ready” and can use some better documentation, bug fixes and beautifying. Still it holds value to us SolidJS devs out there.
All set? Let’s go -
I’m going to follow SolidJS dev-tools repo’s recommendations, which instruct to install the solid-devtools entire package, but unlike what’s written there I’m going to install it as a dev dependency -
yarn add -D solid-devtools
The next thing to do is import the tools into our App entry file. in my case it is the index.jsx file on the project’s root, which now looks something like this:
import 'solid-devtools';
import {render} from 'solid-js/web';

import './index.css';
import App from './App';

render(() => <App />, document.getElementById('root'));
Alrighty then! Let’s see that our application still loads by running yarn start... yep.
But wait… How do I get the extension to work on my browser? What am I expected to see?
Funny (or not), this is not mentioned on the README and so if you’re a new comer you’d be baffled as to the next steps you need to take in order to get some dev tools going.
The Chrome extension
At the time of writing these lines, the extension is yet to be published to Chrome’s extension store, which means that if you’d like to use it in your browser you need to build and install it yourselves. How do we do that?
First thing is to clone the repo to our machine. Once you have it, go into the project root directory and install its dependencies using pnpm i.
The project’s using PNPM as its package manager, so you should install it if you haven’t got it available. This comes more critical when you attempt to build the extension, since this is a monorepo managed by PNPM.
Our next step is building the extension, and we do that with the pnpm build command. Once done you should have the extension ready in your packages/extension directory. This means that we can attempt to install it on Chrome.
Open your Chrome extension tab and make sure that you got “developer mode” toggled to “on”. Then choose to “load unpacked” and when the file explorer opens you should select the extension package directory.
At this point you should have the extension installed, so let’s check out what it can do.
The debugger
Our first feature is the Debugger. According to the docs it should be “used to get information and track changes of the Solid's reactivity graph.
I’m going to append this to the App’s component like so:
import Pagination from './components/Pagination/Pagination';
import styles from './App.module.css';
import {attachDebugger} from '@solid-devtools/debugger';

function App() {
   attachDebugger();
   return (
       <div class={styles.App}>
           <Pagination
               totalPages={10}
               pagesBuffer={5}
               onChange={(newCursor) => console.log('newCursor :>> ', newCursor)}
           />
       </div>
   );
}

export default App;
Launching the application again, I open the Chrome dev tools and you can see I have a new tab called “Solid” and inside of it some weird looking information -

Yes, the UI is not the best, but let’s figure out what we have here -
To better understand what I’m about to describe below, please check the component’s code on GitHub
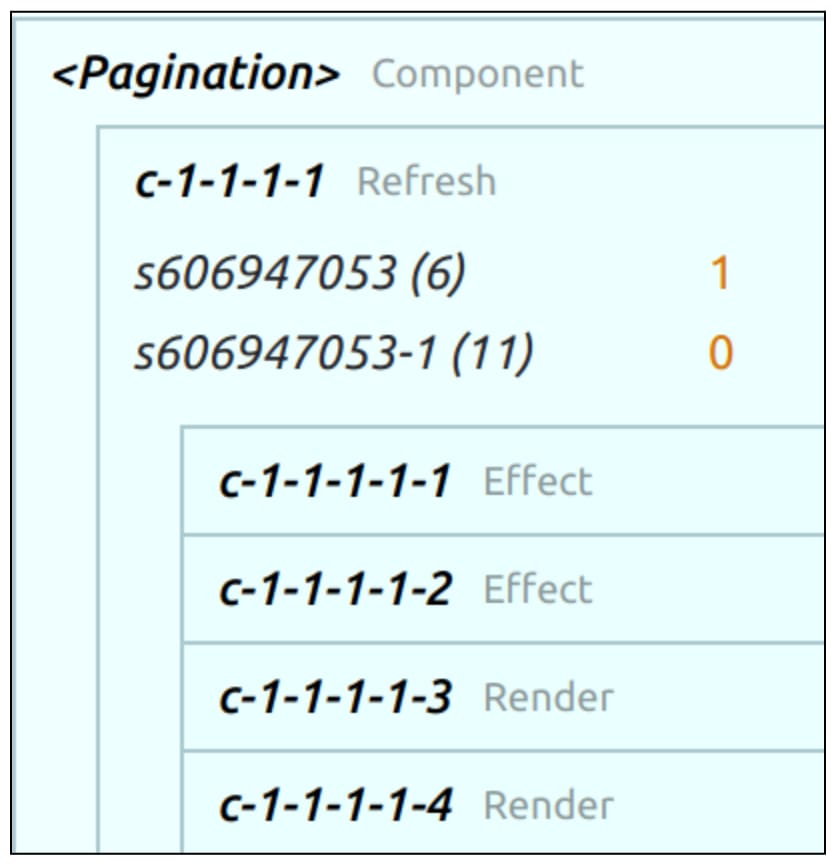
We can see the components we have in this tiny application, which are App and Pagination.
I’m really not sure what these “c-1-1-1-1-1” stand for, but what’s interesting is the type they have.
You see that some say “effect” and some say “render”, which I believe stand for the effects and renders that the current component has on the reactivity graph.
If so, in our Pagination component, for example, we have 2 renders and 2 effects.
The “s…” (such as the “s606974053”) probably stands for the signals this component has. And Indeed, this component has 2 signals - one is the “cursor” and the other is the “bufferGap”.
When I click the component’s “NEXT” button I can see on the debugger that the cursor signal has changed and it triggered 2 effects -
The one which involved the onChange callback -
createEffect(on(cursor, (value) => props.onChange?.(value), {defer: true}));
And the one which computates the bufferGap -
createEffect(() => {
       let newBufferGap = bufferGap();
       if (props.totalPages - cursor() < buffer.length) {
           newBufferGap = props.totalPages - cursor() - buffer.length;
       }
       setBufferGap(newBufferGap);
   });
And then it triggers 2 renderings (one for deselecting the previous item and one for selecting the new one). We can also see that the cursor signal (s606947053) has change to 1 -
Ok… nice, let’s click the “NEXT” button a few more times and we can then see that the other signal, that is the bufferGap, changes as well:

Cool. We have a way to monitor the changes in our reactivity graph and check the different values signals hold. This will help us understand our application state at any time.
The Logger
Another cool feature of the dev-tools is the “Logger” which is used “For debugging only the pinpoint places parts of the Solid's reactivity graph you are concerned with, right in the console you use all the time.”
Let’s put this into practice. I will attempt to put a logger on createEffect code within our Pagination component (the logger needs to be installed independently so make sure you do that first):
import {debugComputation} from '@solid-devtools/logger';

...

createEffect(() => {
       debugComputation();
       let newBufferGap = bufferGap();
       if (props.totalPages - cursor() < buffer.length) {
           newBufferGap = props.totalPages - cursor() - buffer.length;
       }
       setBufferGap(newBufferGap);
   });
Now I should see some interesting console logs, refreshing the page and opening the console tab on my dev tools. Just upon the refresh I see that there is a effect which runs:

Notice that this effect has 2 Sources, which means that there are 2 signals, or reactive members it “listens” to, which is a critical information to have! One is the “cursor” and the other one is the “bufferGap”.
I will now click the “Next” button a few times. Let’s see what logs out:

The effect runs as a result of change to signal s606947053, which is the “cursor”. Yep, this is expected. Let’s click the “Next” button a few more times…
wait a minute, see what happens when the cursor reaches 6 -

The effect runs twice(!). Once for the “cursor” signal change and the second time for changes in the “bufferGup” signal. This happens since the effect code depends on the bufferGap and when we change it due to computation, the effect runs again.
That’s not very good…
Let’s see if we can change that behavior and save ourselves an effect run…
createEffect(() => {
       debugComputation();
       let newBufferGap = 0;
       if (props.totalPages - cursor() < buffer.length) {
           newBufferGap = props.totalPages - cursor() - buffer.length;
       }
       setBufferGap(newBufferGap);
   });
Yeah! Setting the newBufferGap to 0 instead of bufferGap() means that this effect will no longer “listen” to when the bufferGap changes. We already have a win for the SolidJS dev-tools ;)
Wrapping up
Though the SolidJS dev-tools is far from being “production ready'' you can already use it and get more insights on what’s going on within your SolidJS application. There are a few more features to the dev-tools that I might cover in the future (such as the Locator), but for now I think that both the Debugger and Logger already give great value.
This project is surely something to keep an eye for.
As always, if you have any comments or questions be sure to leave them in the comments below.
Hey! If you liked what you've just read check out @mattibarzeev on Twitter 🍻
Photo by Agence Olloweb on Unsplash


Oldest comments (2)
Thank you so much for this article!
I knew the docs were weak, but reading this makes me feel like they don't exist at all xd
I'm probably going to link this in the extension/main readme. This is great.
Just regarding the "c-1-2-3-1-2-2..." names, now you can use the babel transform to have signals and memos automatically named.
Awesome mate, my pleasure! 🍻
Great to hear about the babel transform issue (saw the open issue on the repo)
Great work, keep it going and I will help wherever I can 👍